Data connection and preparation
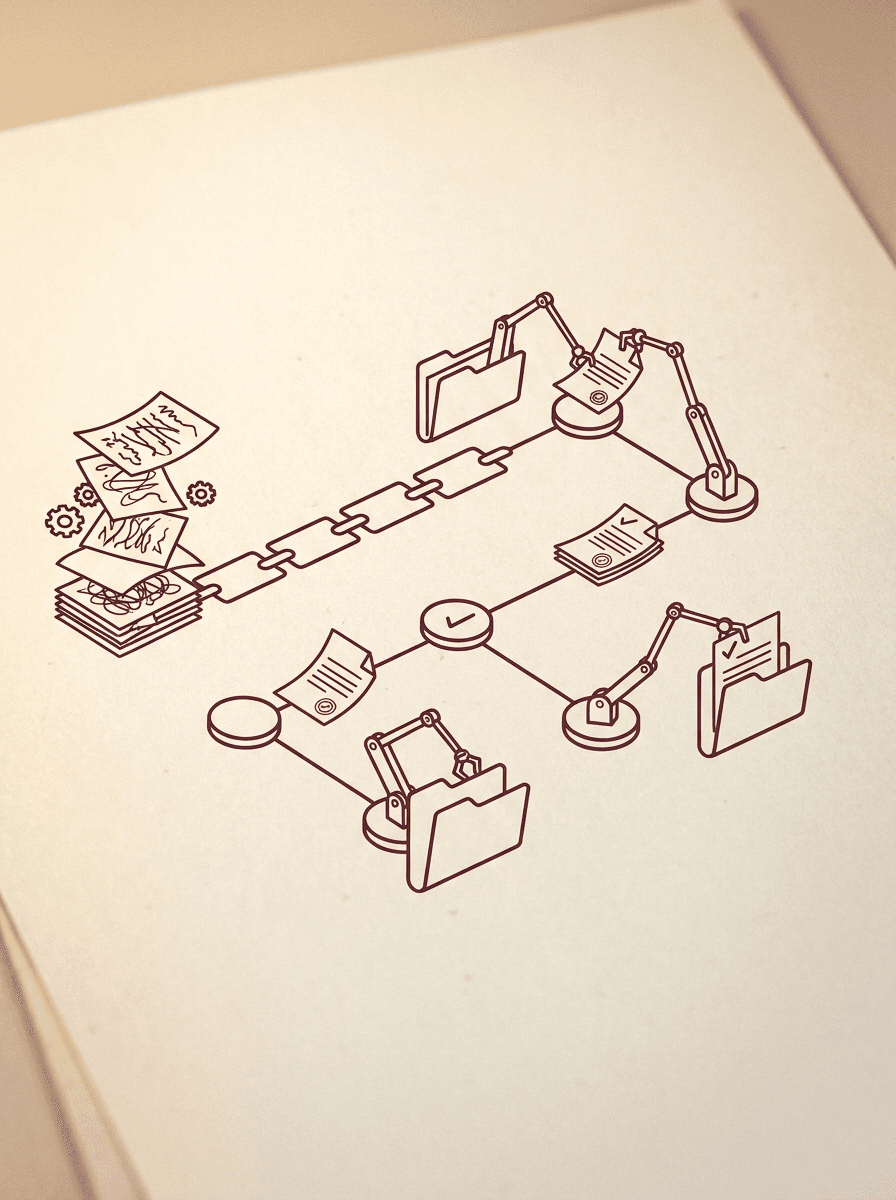
Bring agreed sources together and check identifiers, dates and missing values. Document the transformations so the report can be reconciled with the original systems.
Solutions / What we do
See the business clearly enough to act.
Connect your data, agree what the numbers mean and give each team a useful view of performance and open work.

The opportunity
A chart is only helpful when people trust the information and know what to do with it. We work backwards from decisions to define metrics, connect appropriate sources and show both the overview and the records behind it.
What we can help with
Scope the parts you need, connect what you already have, and build from a useful first release.
Bring agreed sources together and check identifiers, dates and missing values. Document the transformations so the report can be reconciled with the original systems.
Agree how each measure is calculated, what is excluded and how often it updates. Separate estimates and incomplete data from confirmed values.
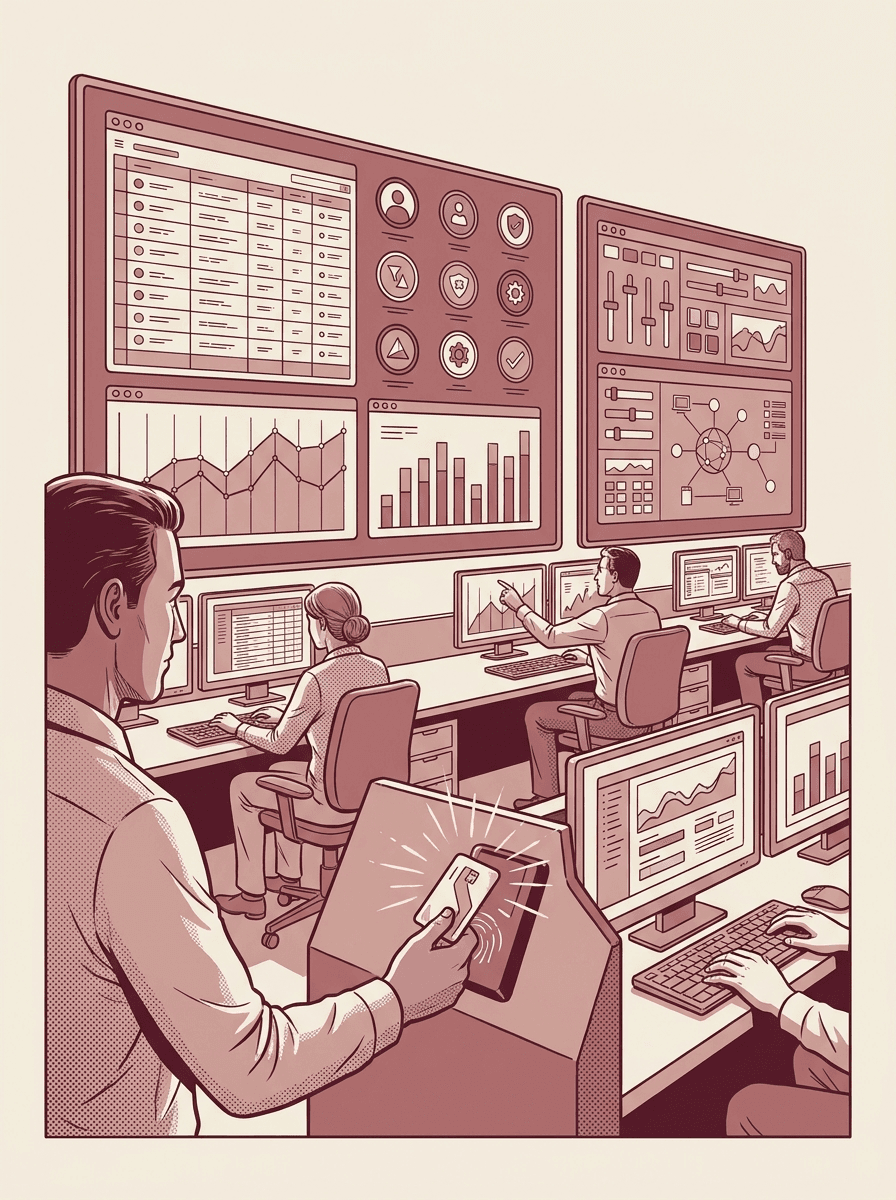
Design views for the decisions each role makes. Use relevant filters, comparisons and drill-downs while restricting access to sensitive underlying records.
Provide scheduled summaries, controlled exports or threshold alerts where useful. Connect an exception to its owner and underlying work rather than stopping at a chart.

Built around your context
A few decisions to agree together before delivery begins.
Data quality issues are shown rather than hidden by a polished chart.
Refresh frequency should match the decision being made.
Sensitive drill-downs and exports require explicit access rules.
A few useful answers
Every project starts with its own context. Here are the questions we hear first.
Yes. We can build in an existing business intelligence tool or develop a custom view, depending on the audience, data and interaction requirements.
We profile the sources and identify gaps before promising a particular report. The scope may include validation, cleanup rules or changes to how information is captured.
We agree a refresh schedule supported by the source systems. Dashboards should show freshness clearly so a scheduled update is not mistaken for live data.
Start a conversation
Tell us where the work gets stuck. We’ll help you identify a useful starting point and the right scope for it.