Google Analytics 4, read for you
Unique visitors, total visits and page views for 7, 30 or 90 days, with a daily chart and the top pages. Admin pages and staging traffic are excluded.
System Integration / Data · Ready-made solution
Google Analytics answers "how many visitors", your email provider answers "who opened", and nobody tells you whether ChatGPT is sending anyone. This dashboard joins those sources in one screen inside your own admin panel, in plain English: unique visitors, visits, page views, where visits came from, which AI assistants sent them, how crawlers read the site, and how each email campaign performed. Every figure carries a one-line note on what it does and does not mean, so the team reads it without an analyst.

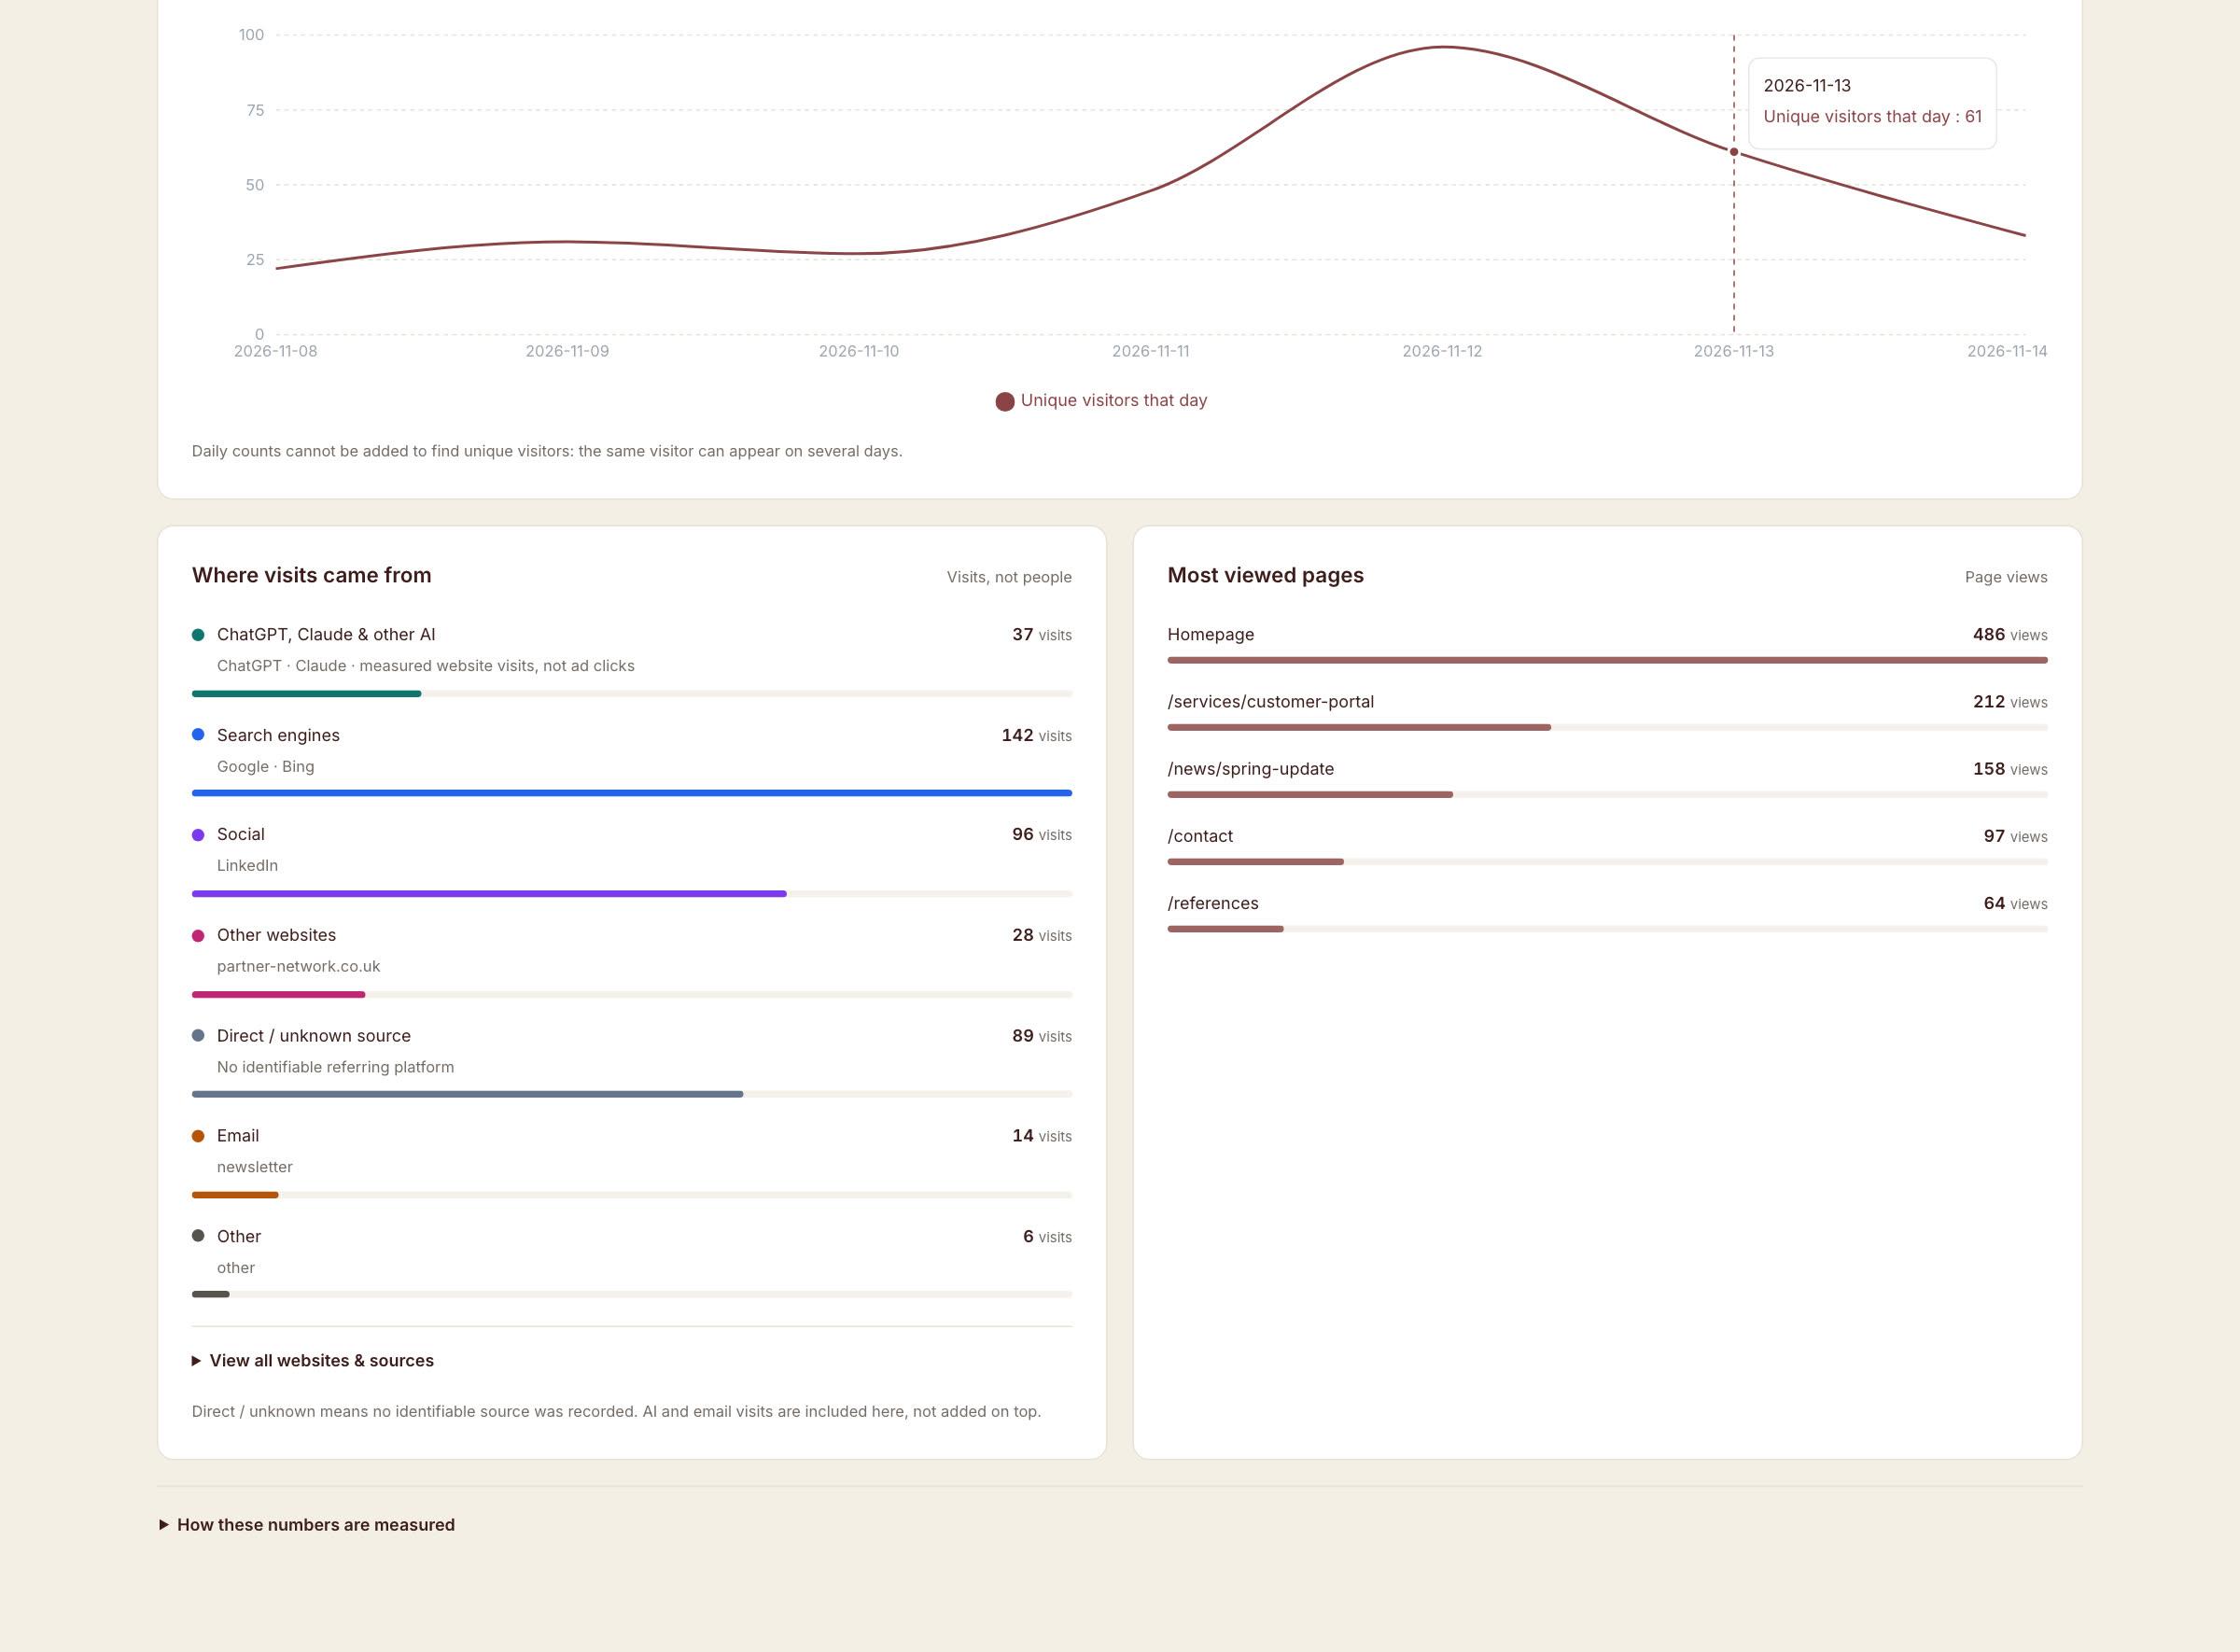
Traffic sources
Search, social, referrals, direct, email and AI assistants on one chart, with the platforms named under each bar. Beside it, the most viewed pages for the same period. Both update with the 7 / 30 / 90-day switch.
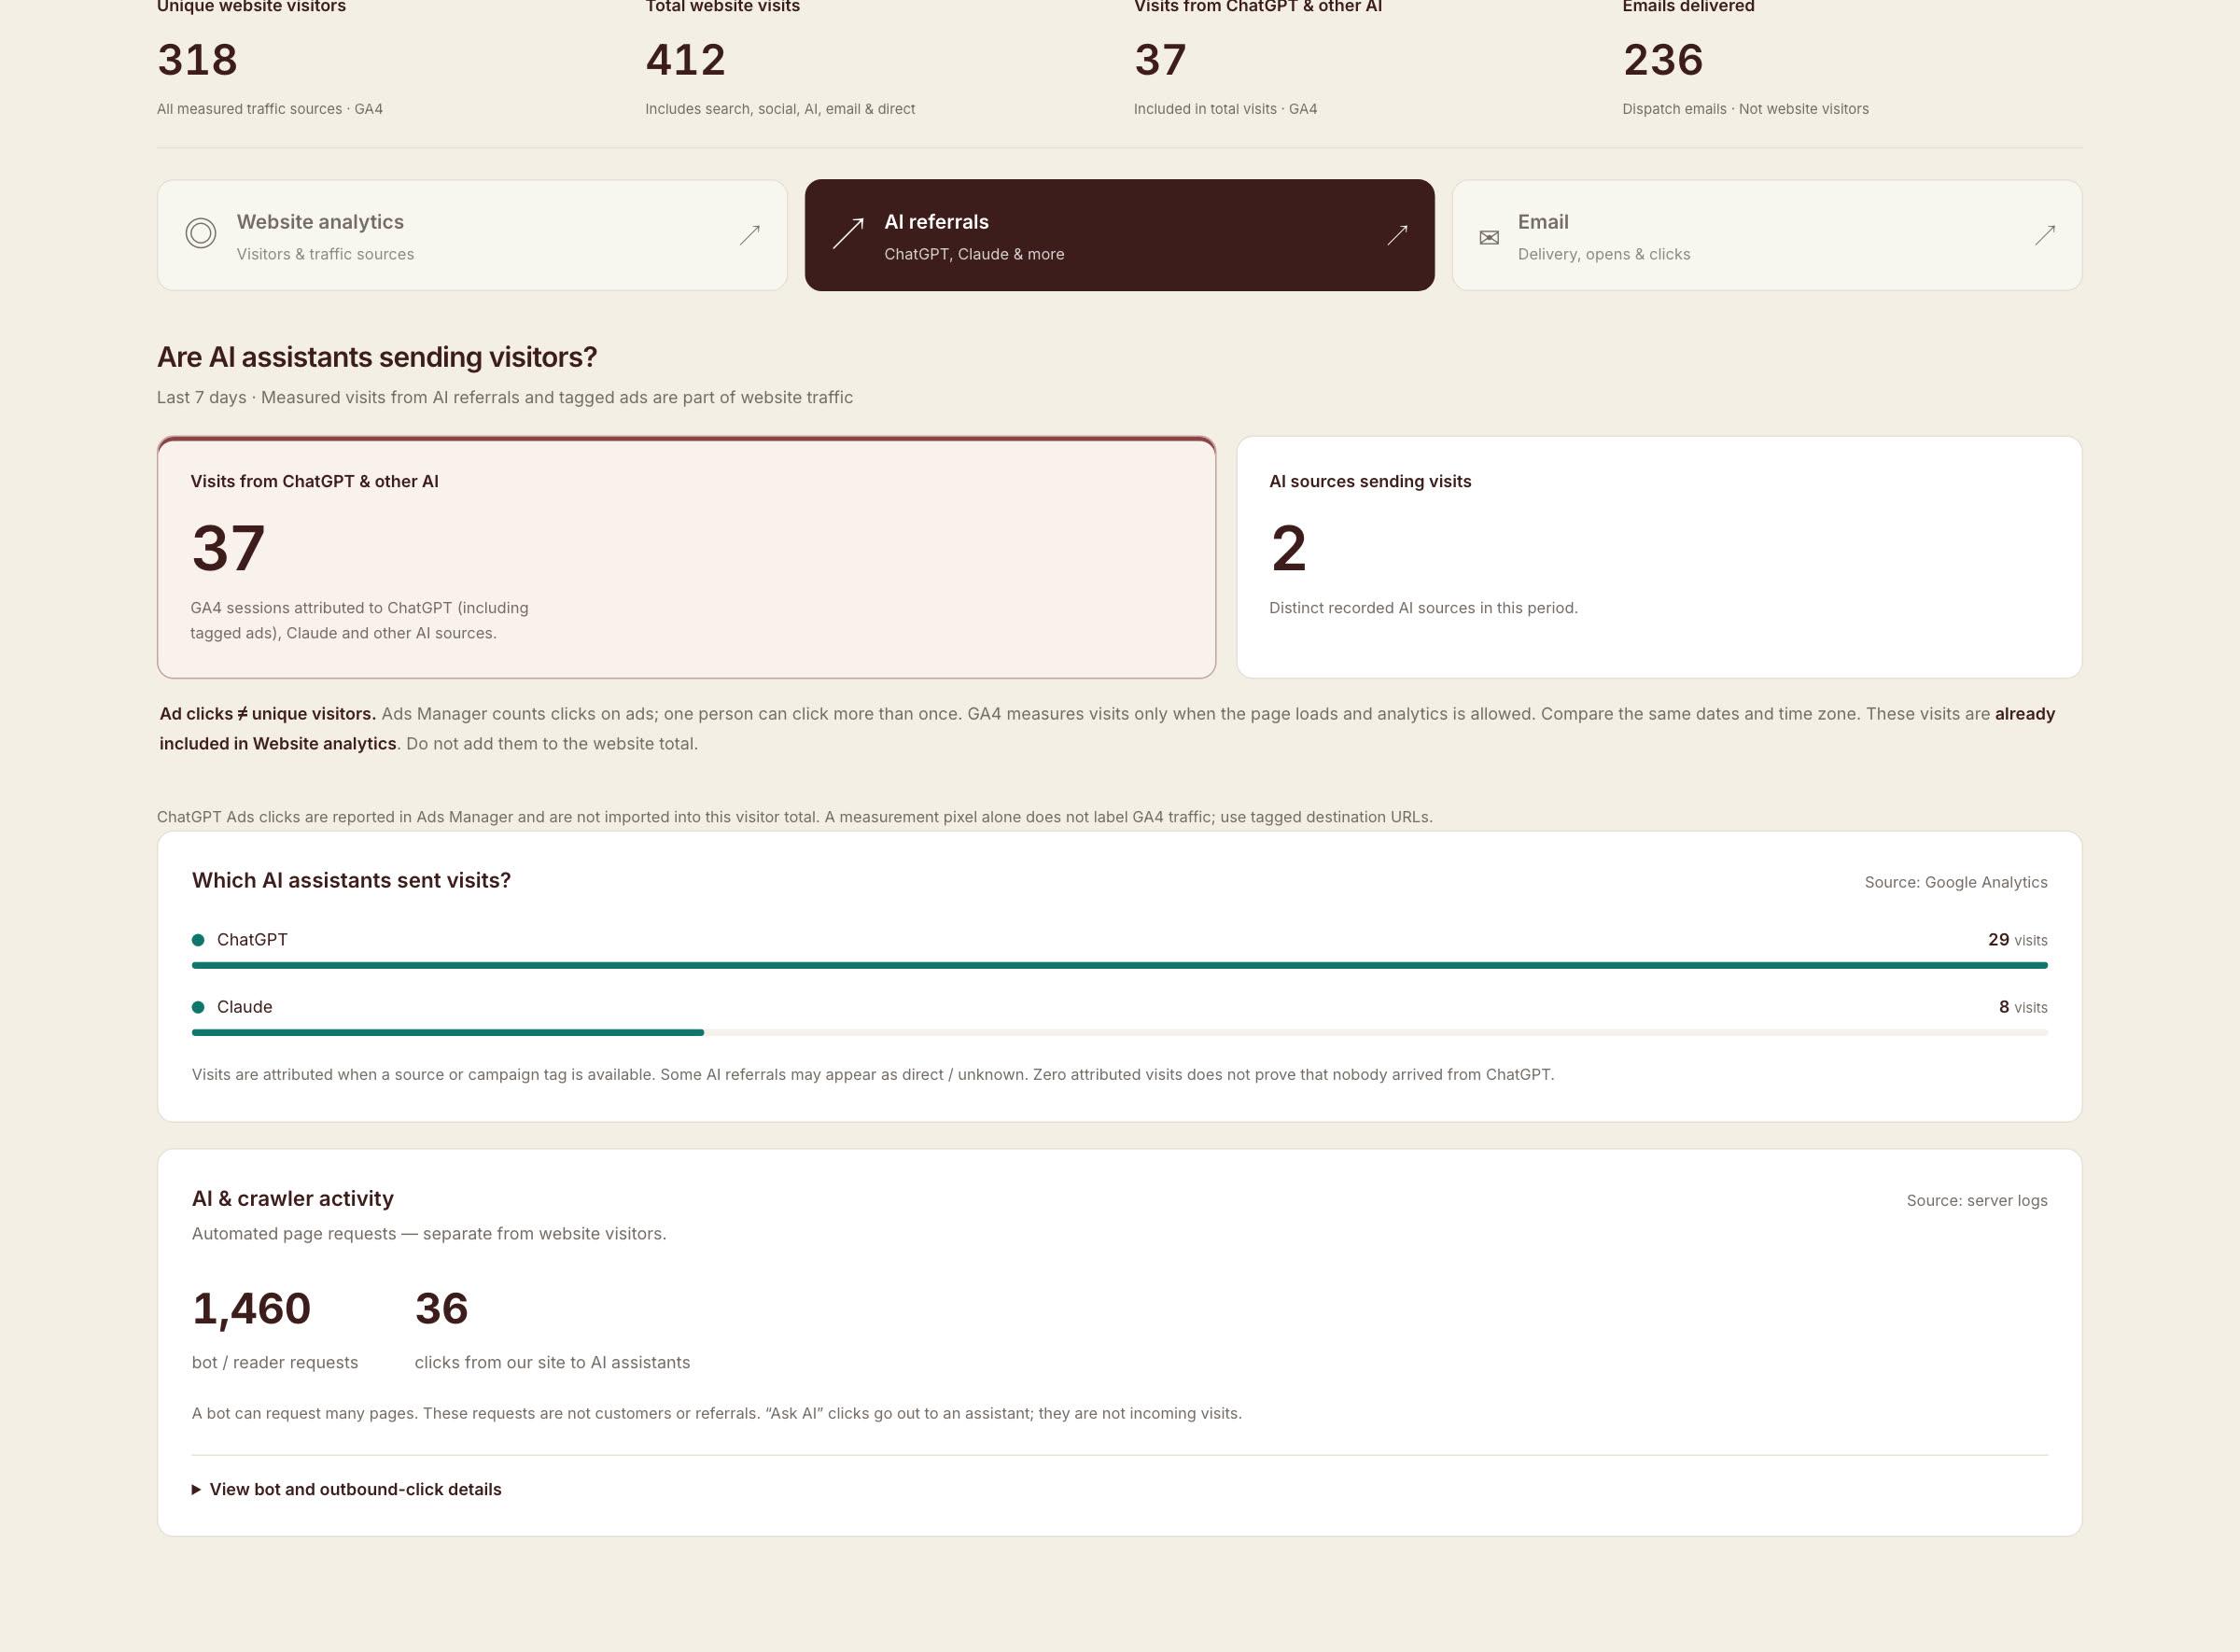
AI referrals
Visits attributed to ChatGPT, Claude and other assistants are shown on their own, with the honest caveat that ad clicks and bot requests are different things. Crawler activity from GPTBot, ClaudeBot and PerplexityBot sits below, from your own server logs.
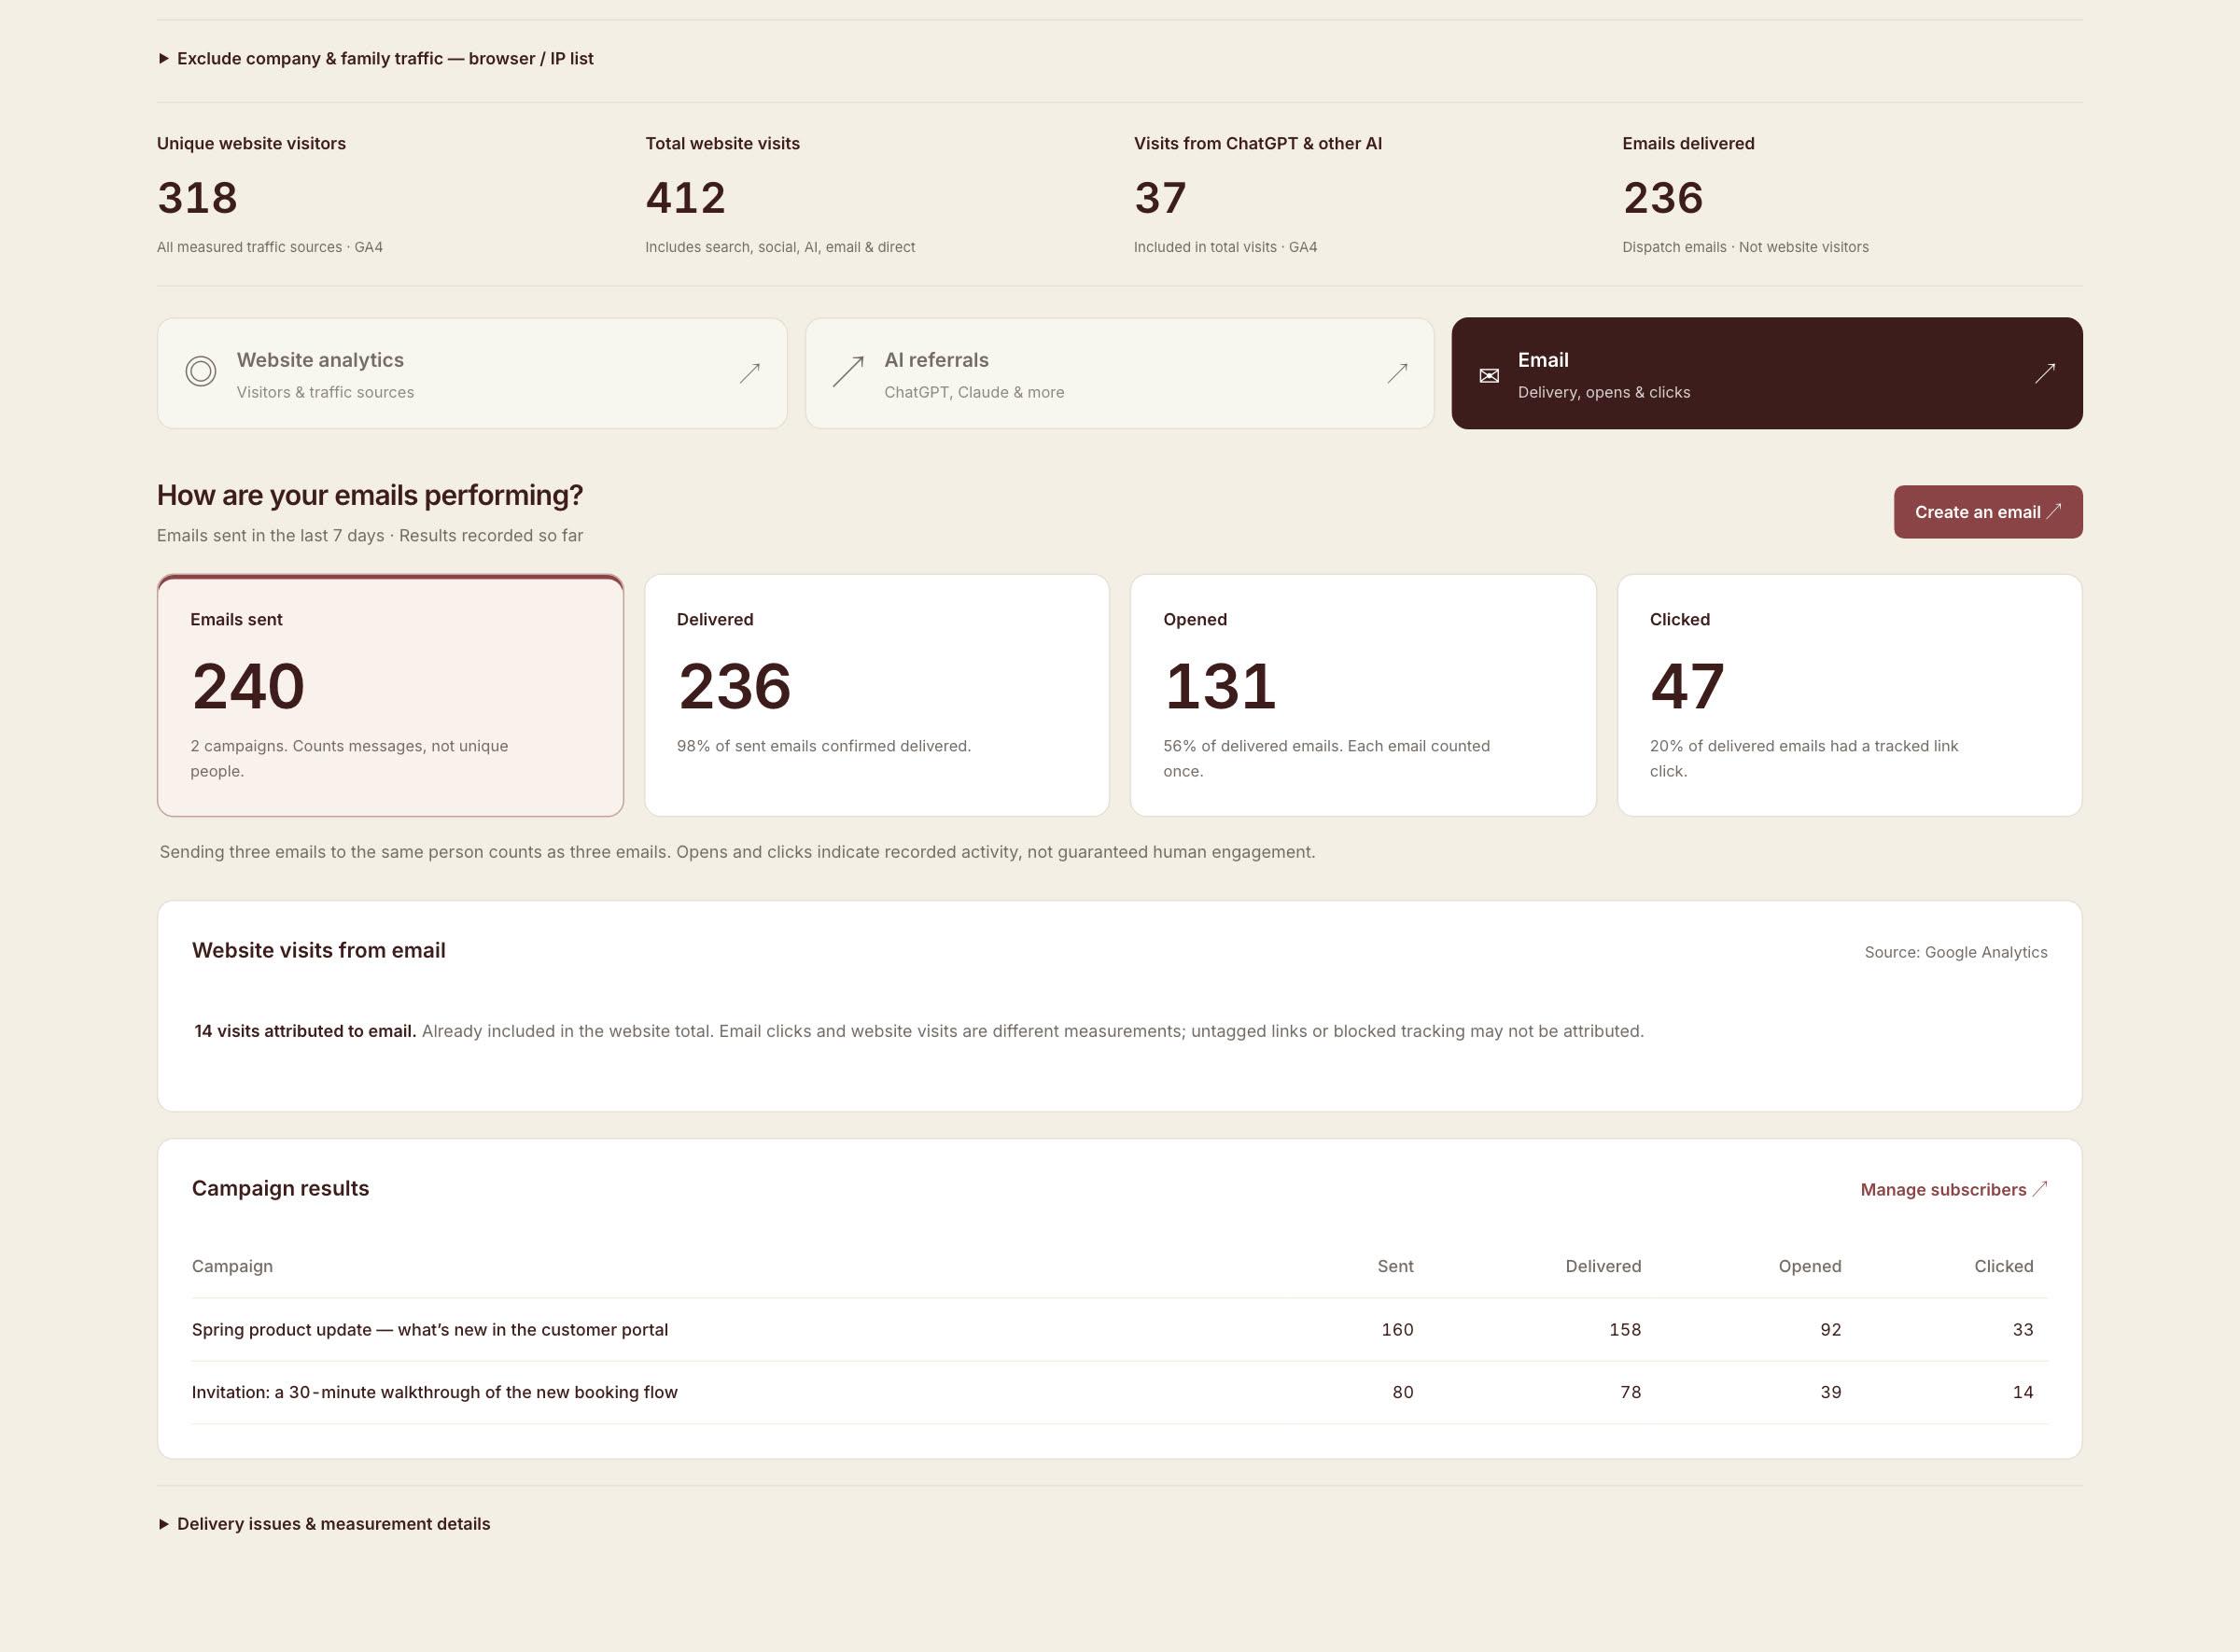
Sent, delivered, opened and clicked for the period, the website visits those emails produced, and a per-campaign table. Delivery issues and measurement notes sit one click away.
Built by KMCP / Inside our platform
View full size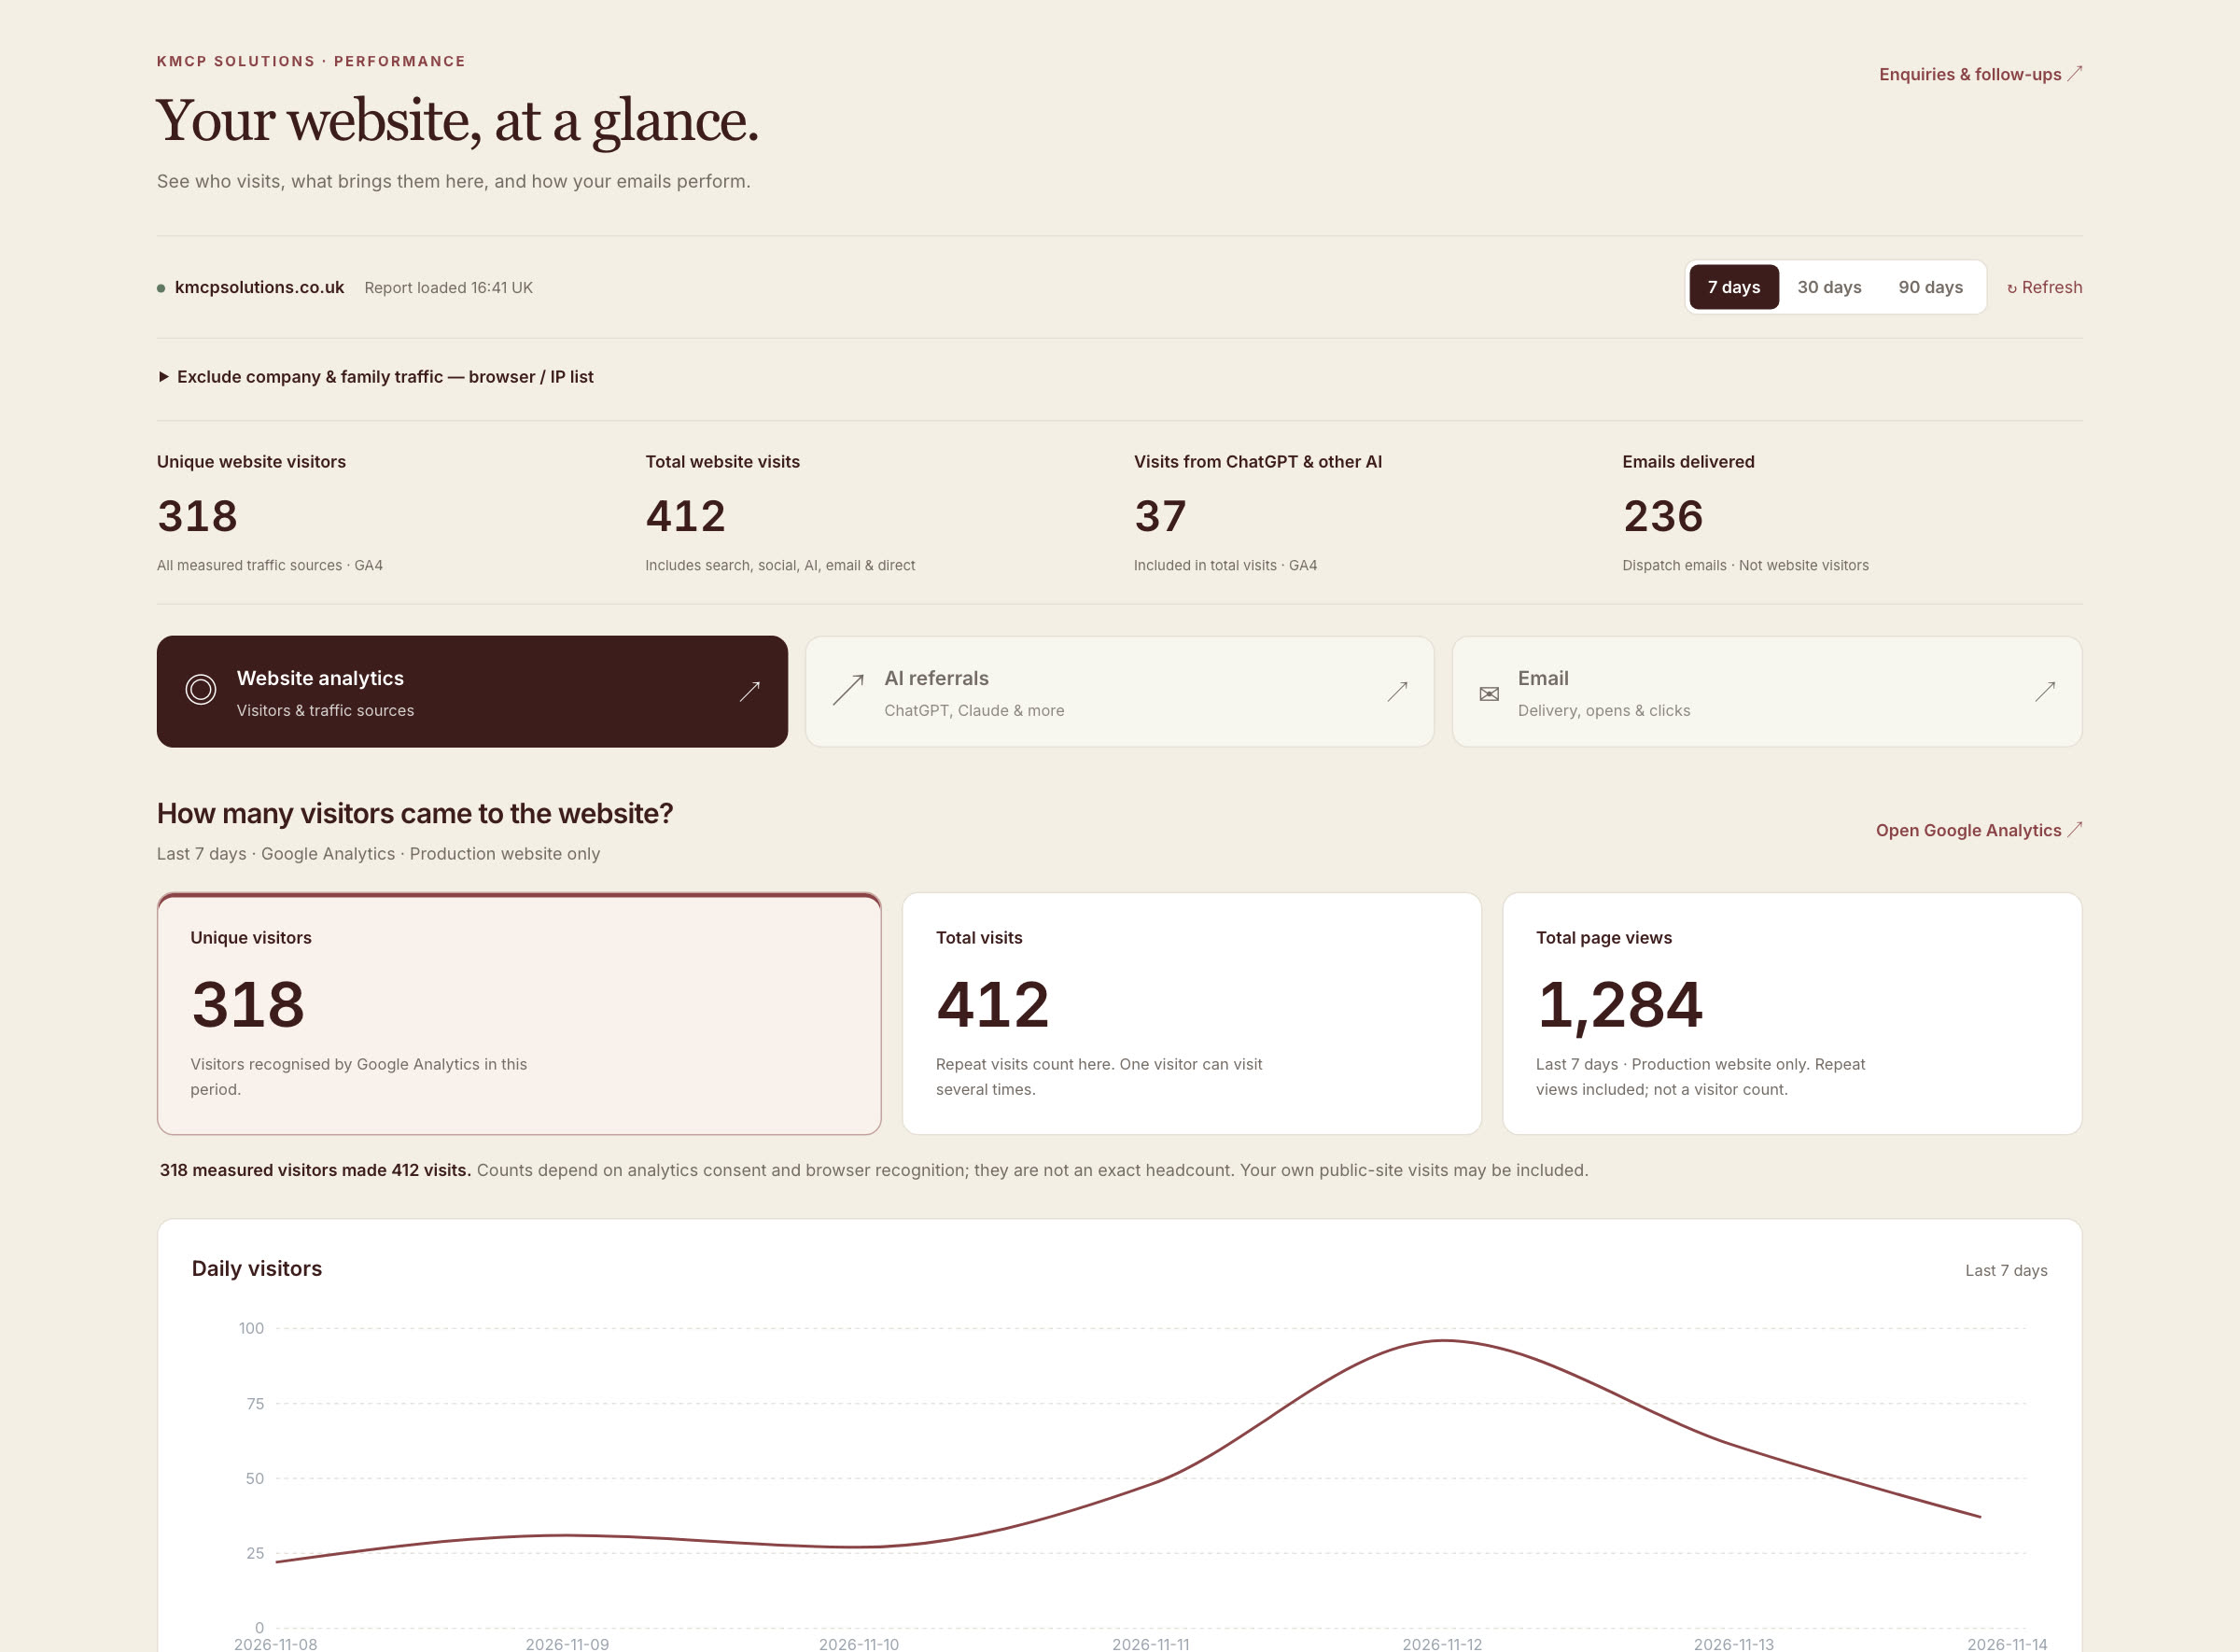
Unique visitors, total visits and page views for 7, 30 or 90 days, with a daily chart and the top pages. Admin pages and staging traffic are excluded.
Search, social, other websites, direct, email and AI assistants on one bar chart, with the platforms behind each (Google, LinkedIn, ChatGPT, Claude…).
Visits attributed to ChatGPT, Claude and Perplexity next to GPTBot, ClaudeBot and PerplexityBot page requests from your server logs, kept clearly apart.
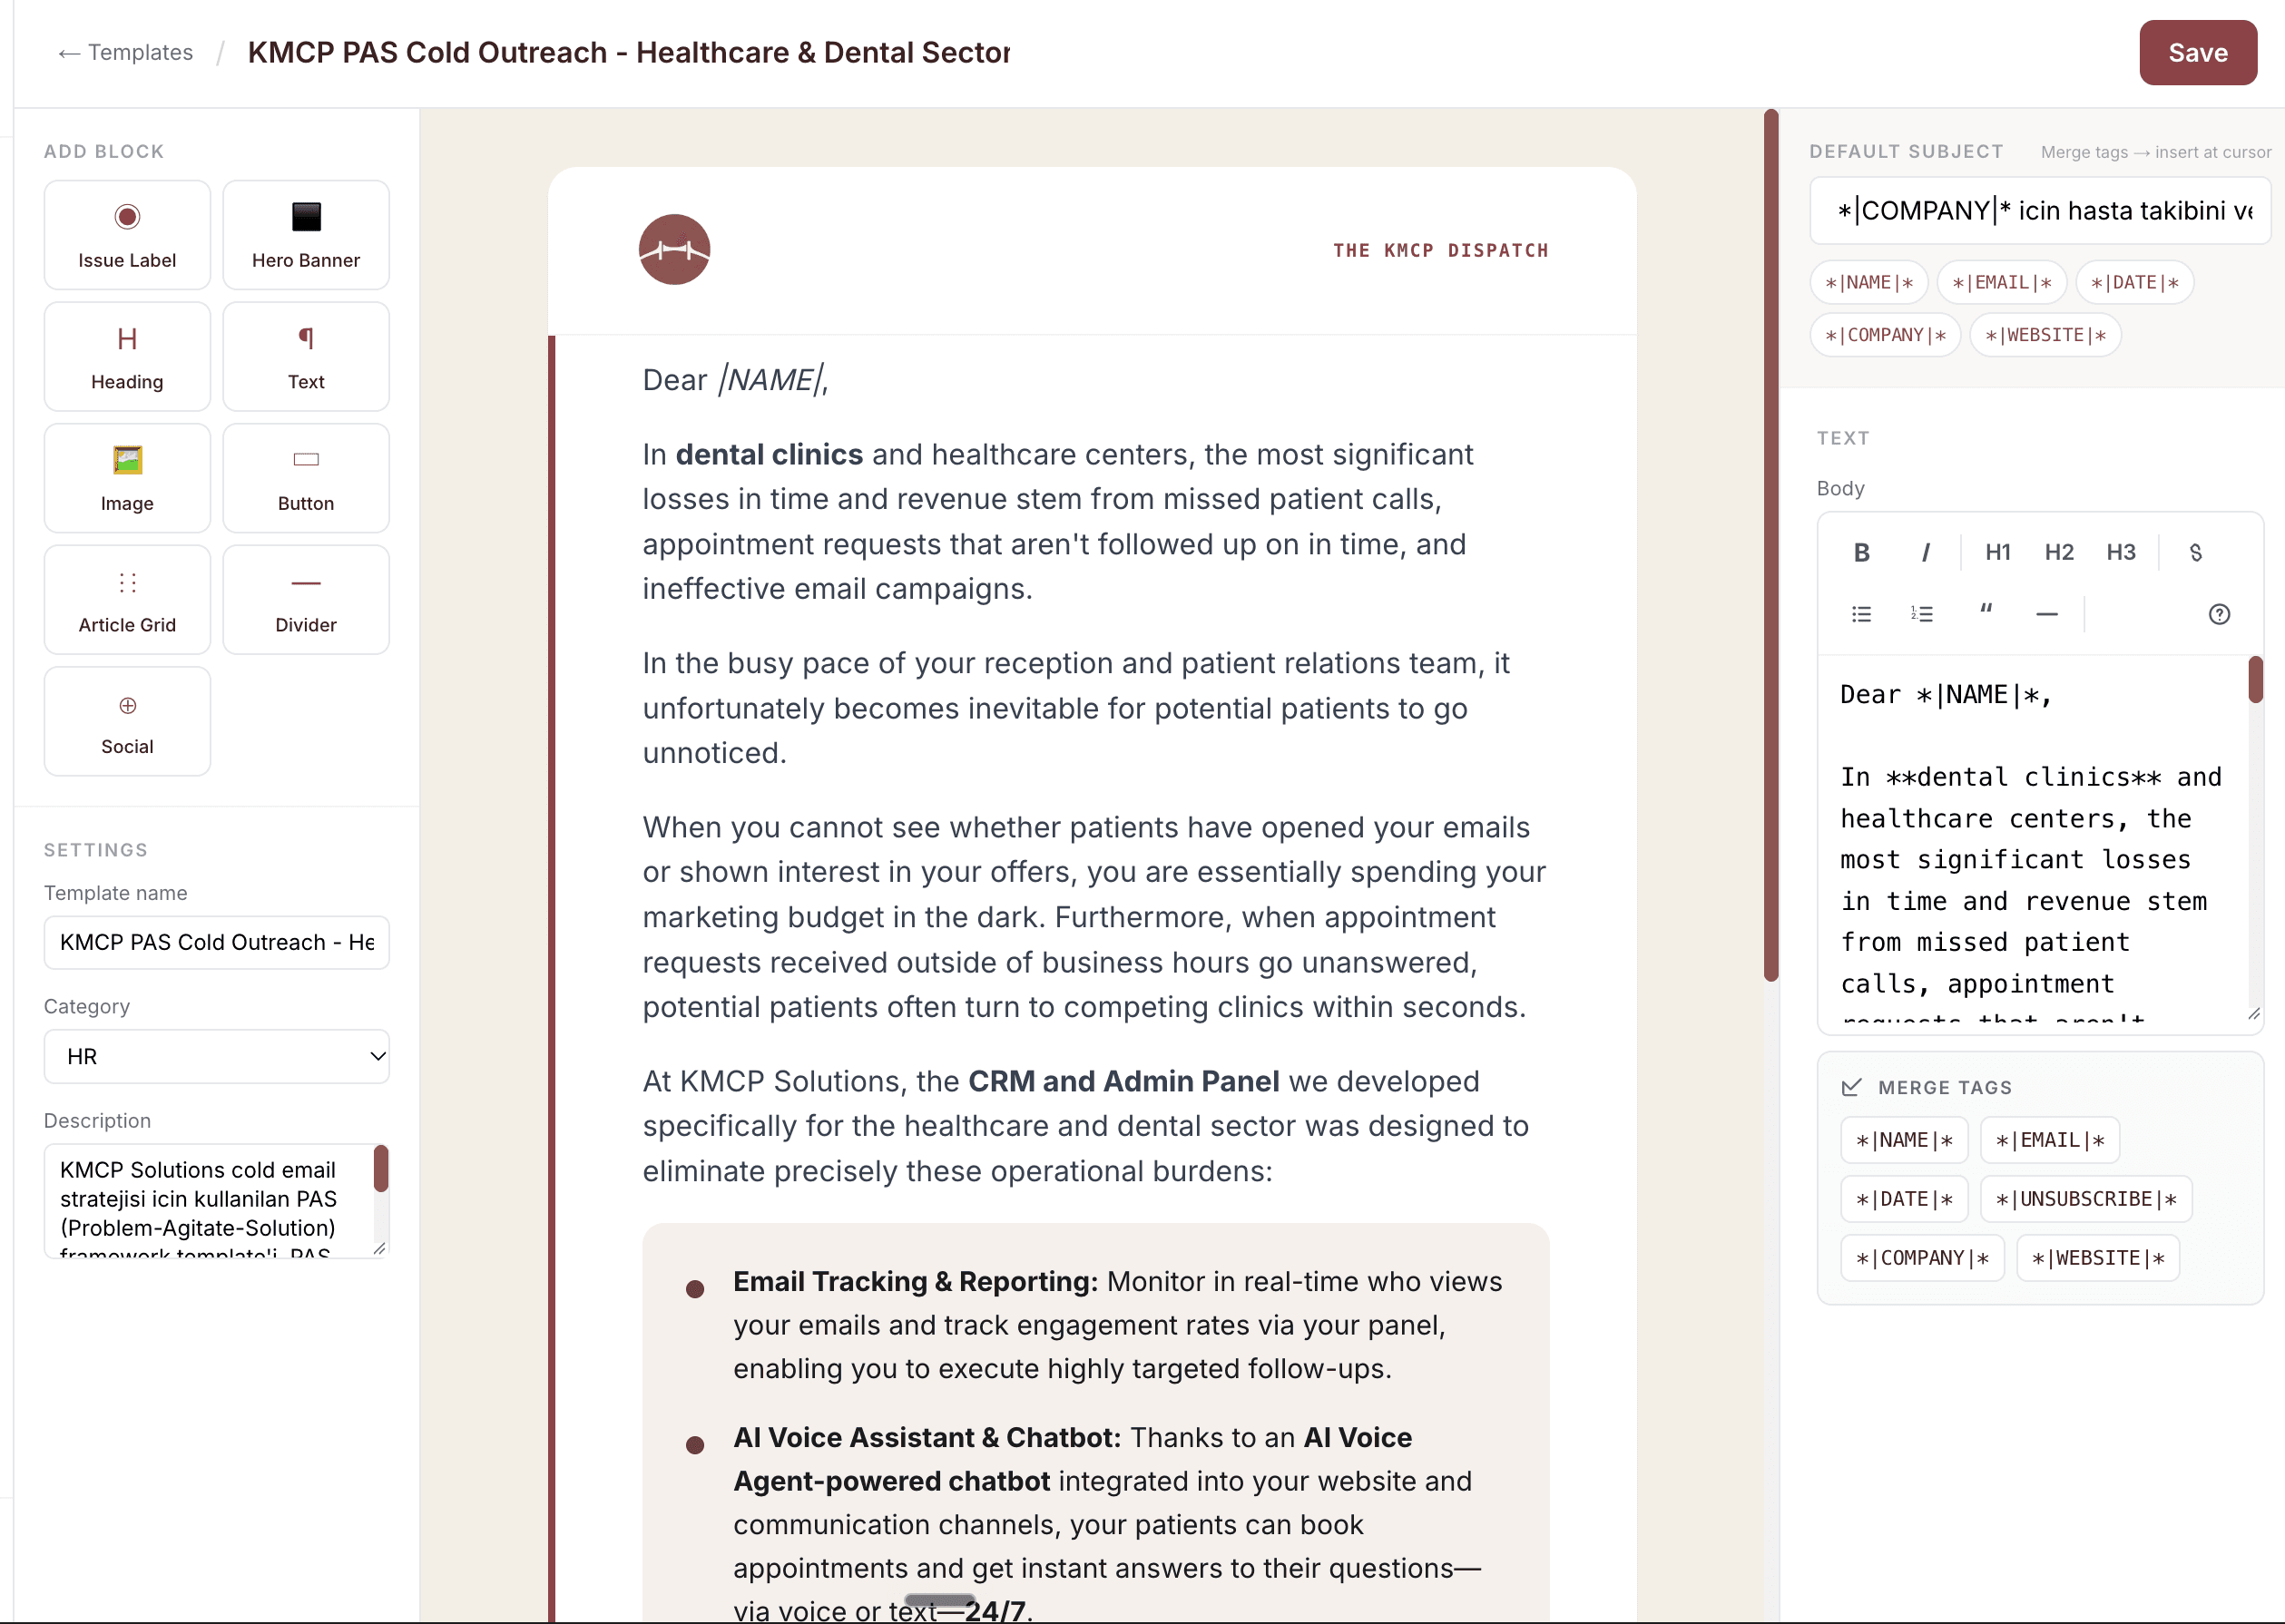
Sent, delivered, opened and clicked per campaign, bounce and complaint counts, and the website visits those emails produced.
Each metric explains its measurement: ad clicks are not visitors, bot requests are not customers, daily counts cannot be added. Company and family traffic can be excluded by browser or IP.
Built with Microsoft Graph, GA4 Data API, Resend webhooks and your own request logs; no third-party analytics subscription, no data leaving your accounts.
An example in practice
A managing director opens the panel on Monday, switches to 30 days and sees 1,140 unique visitors, 37 of them from ChatGPT, and that last week’s product update email was opened by 56% of recipients and sent 14 people to the new portal page. Three questions answered before the first coffee, and no spreadsheet.
More ready-made solutions
 Interactive exampleDocuments & trust
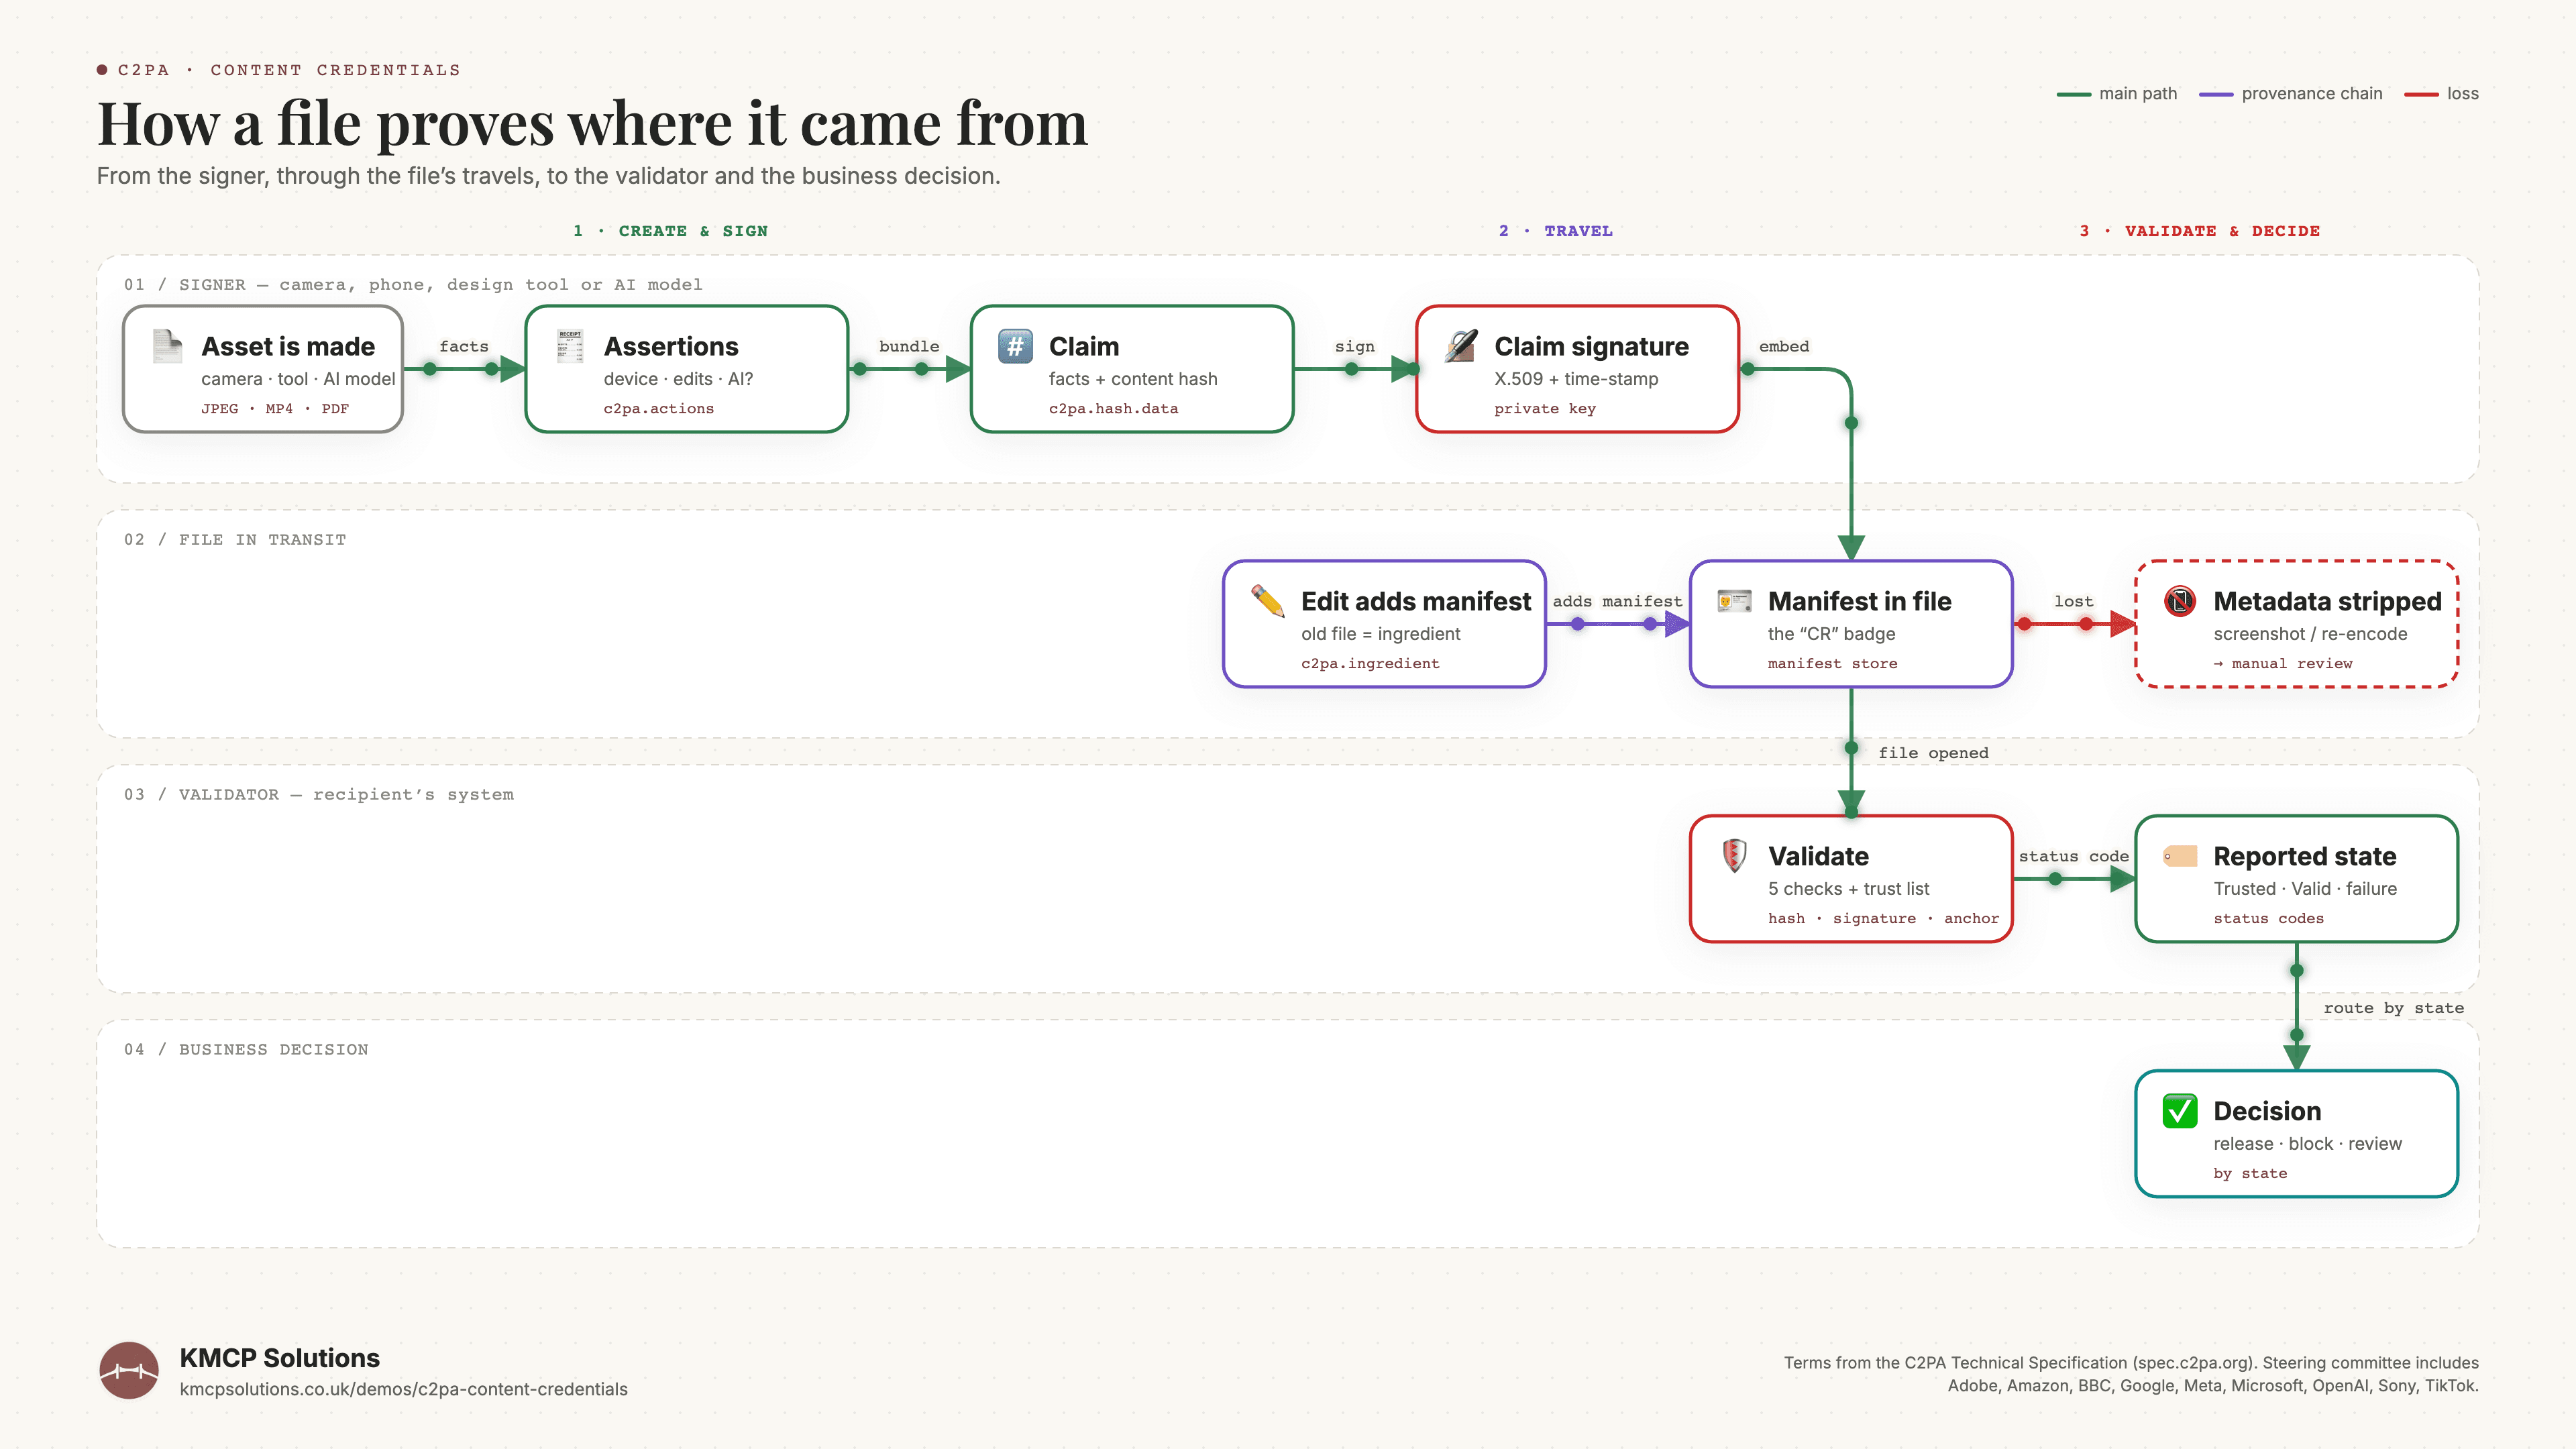
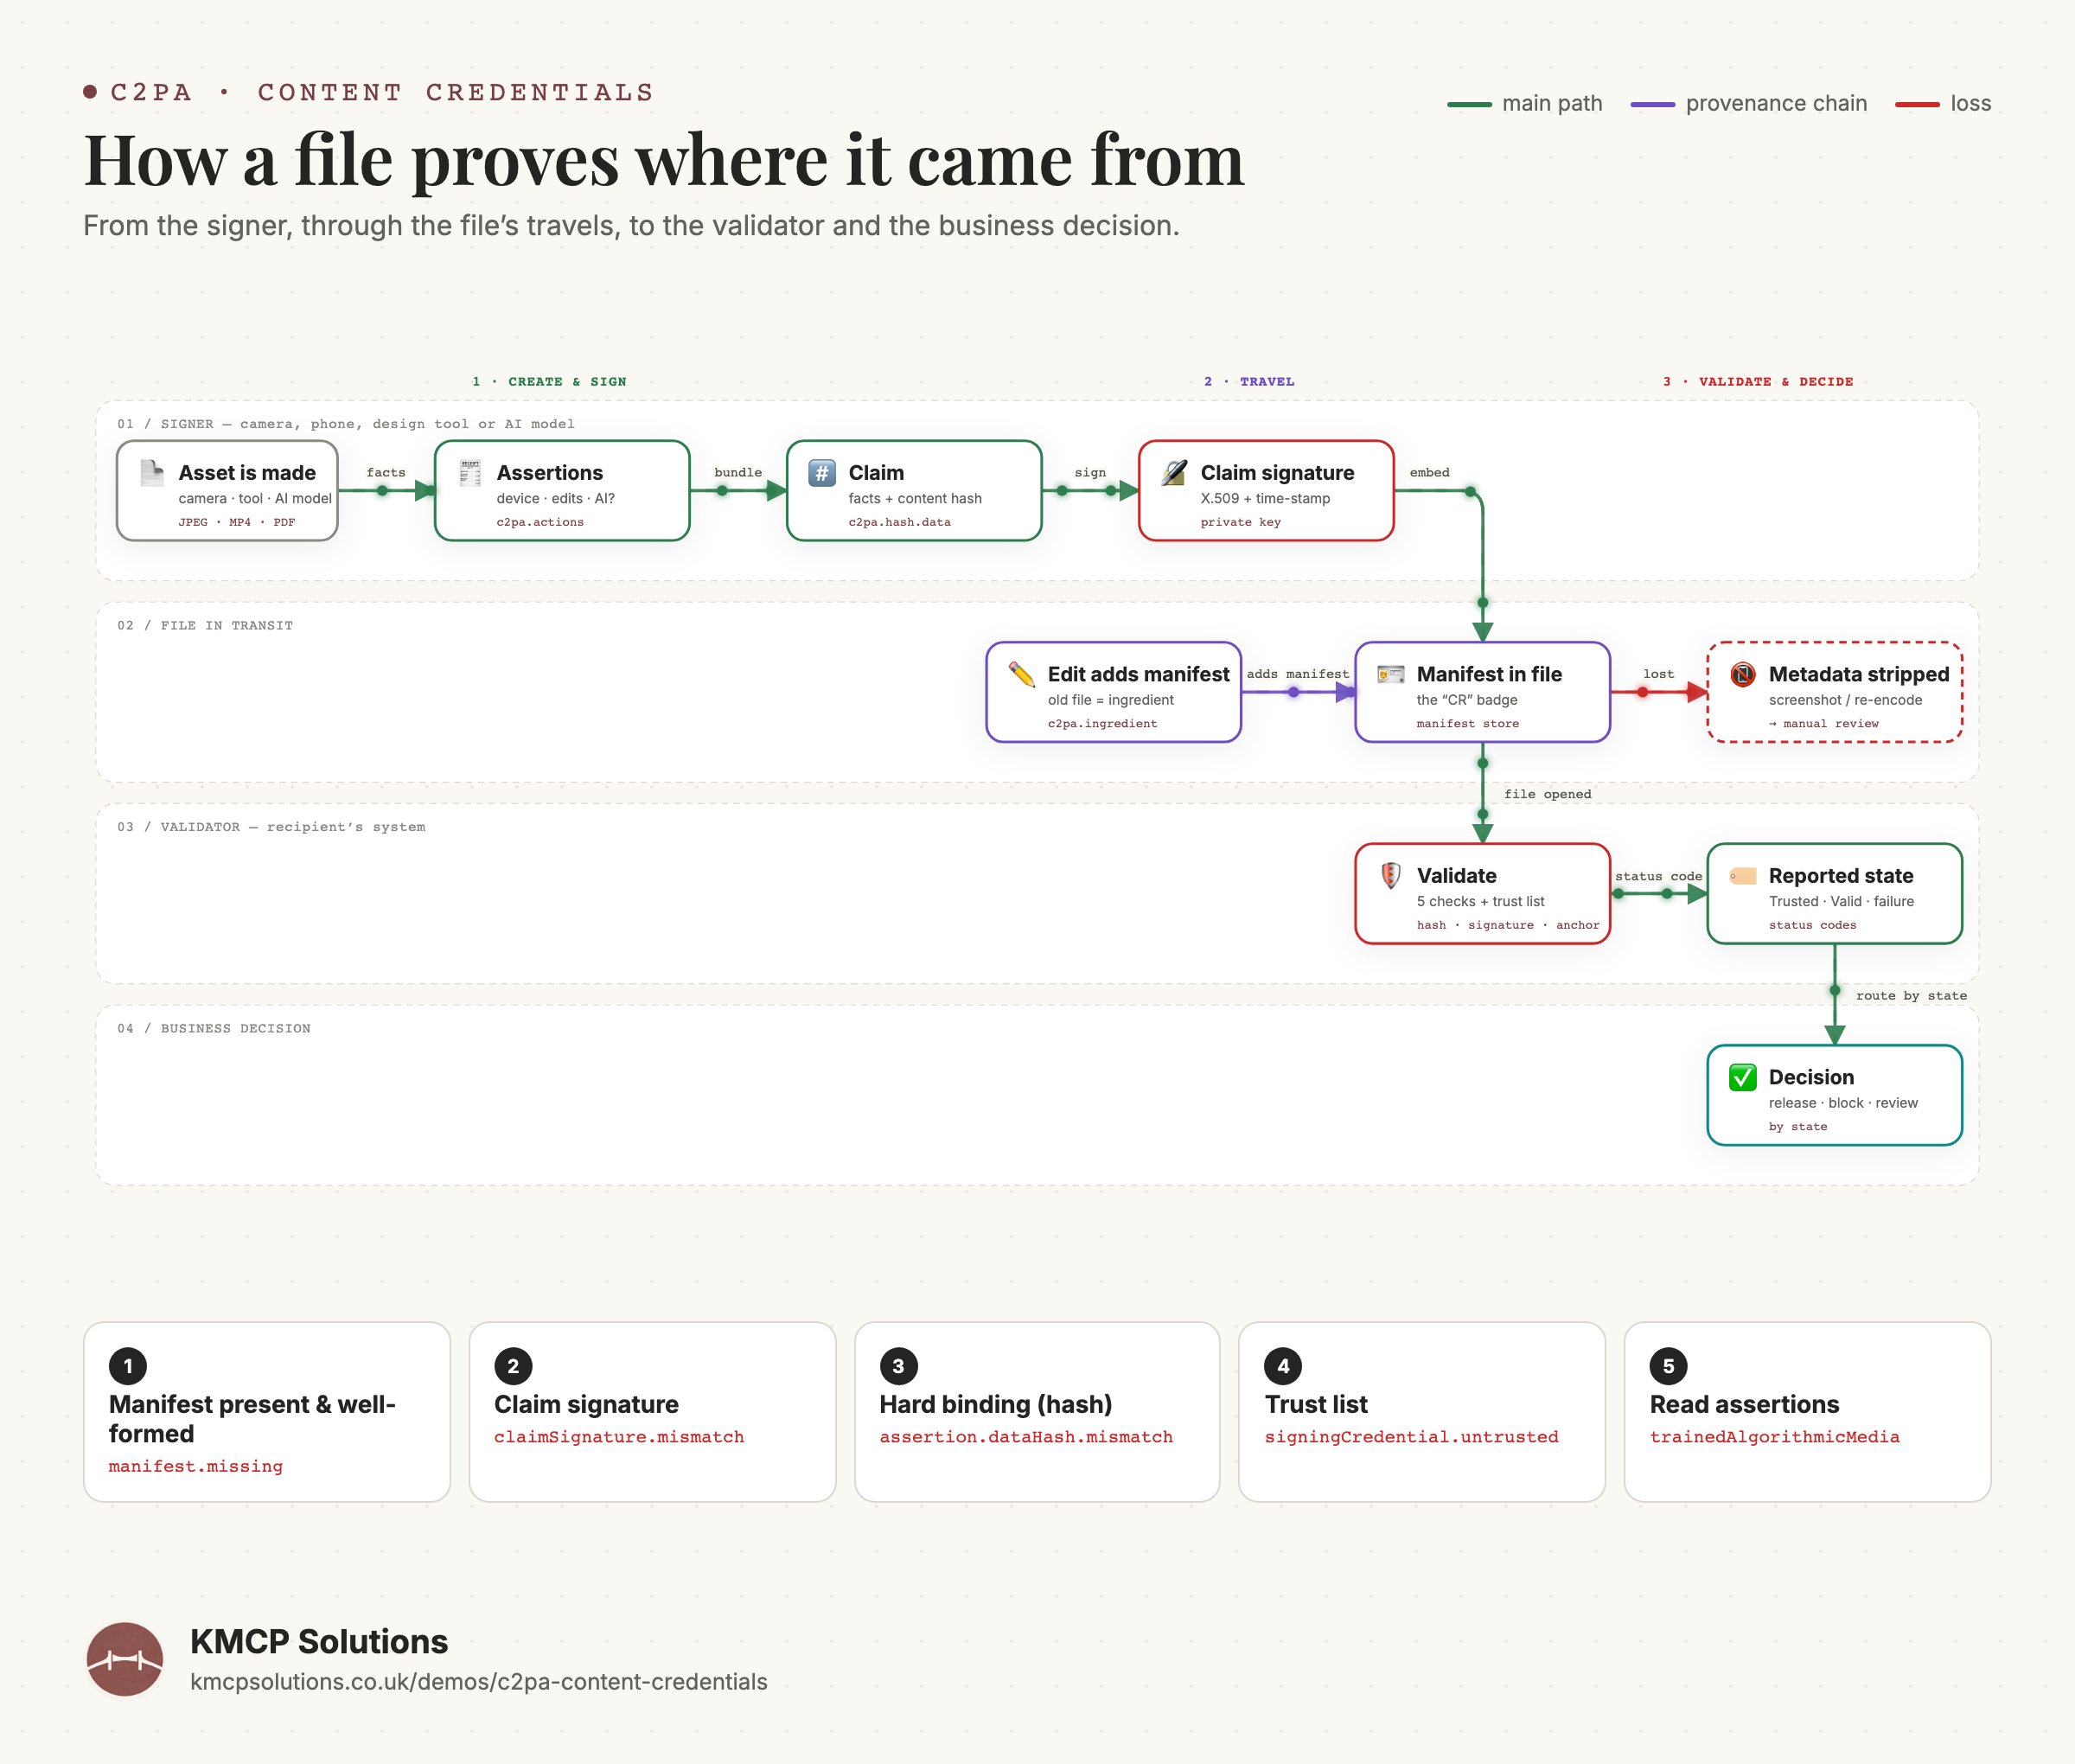
A validator reads a file’s signed history and routes invoices, certificates and media to release, block or manual review before anyone acts on them.
 Ready-made solutionCalendar
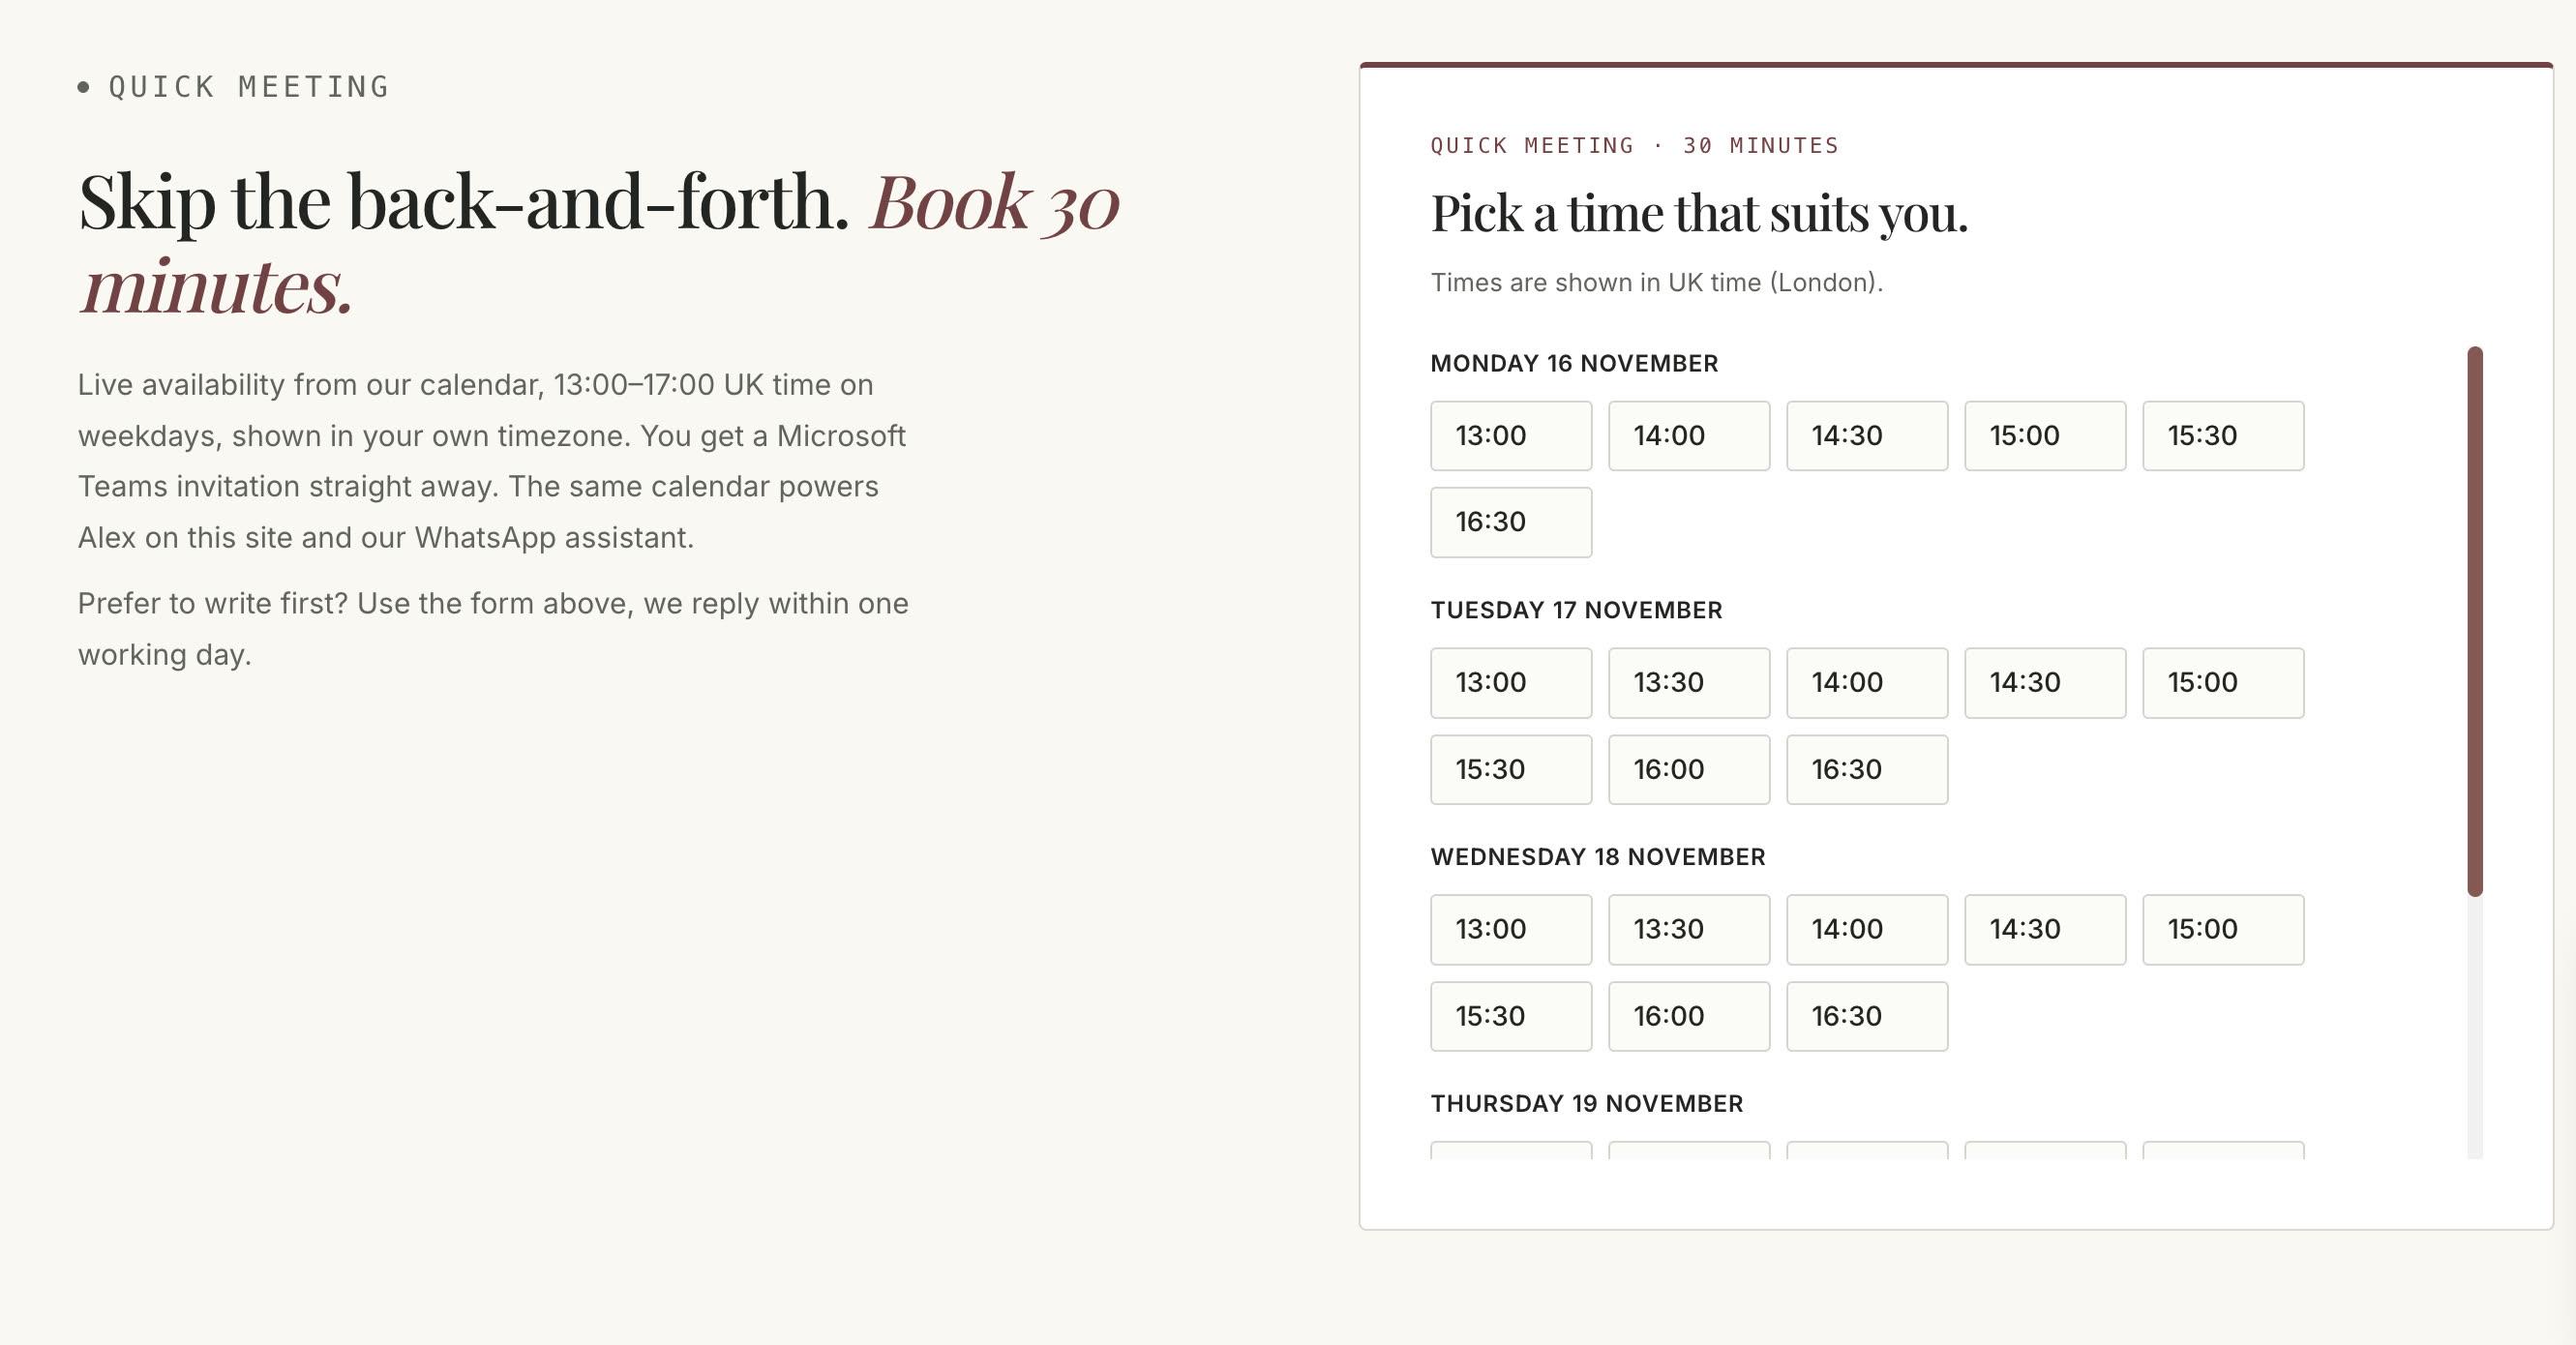
Visitors book a free 30-minute slot from your real Microsoft 365 calendar, in their timezone, and get a Teams invitation at once.
 Ready-made solutionMessaging
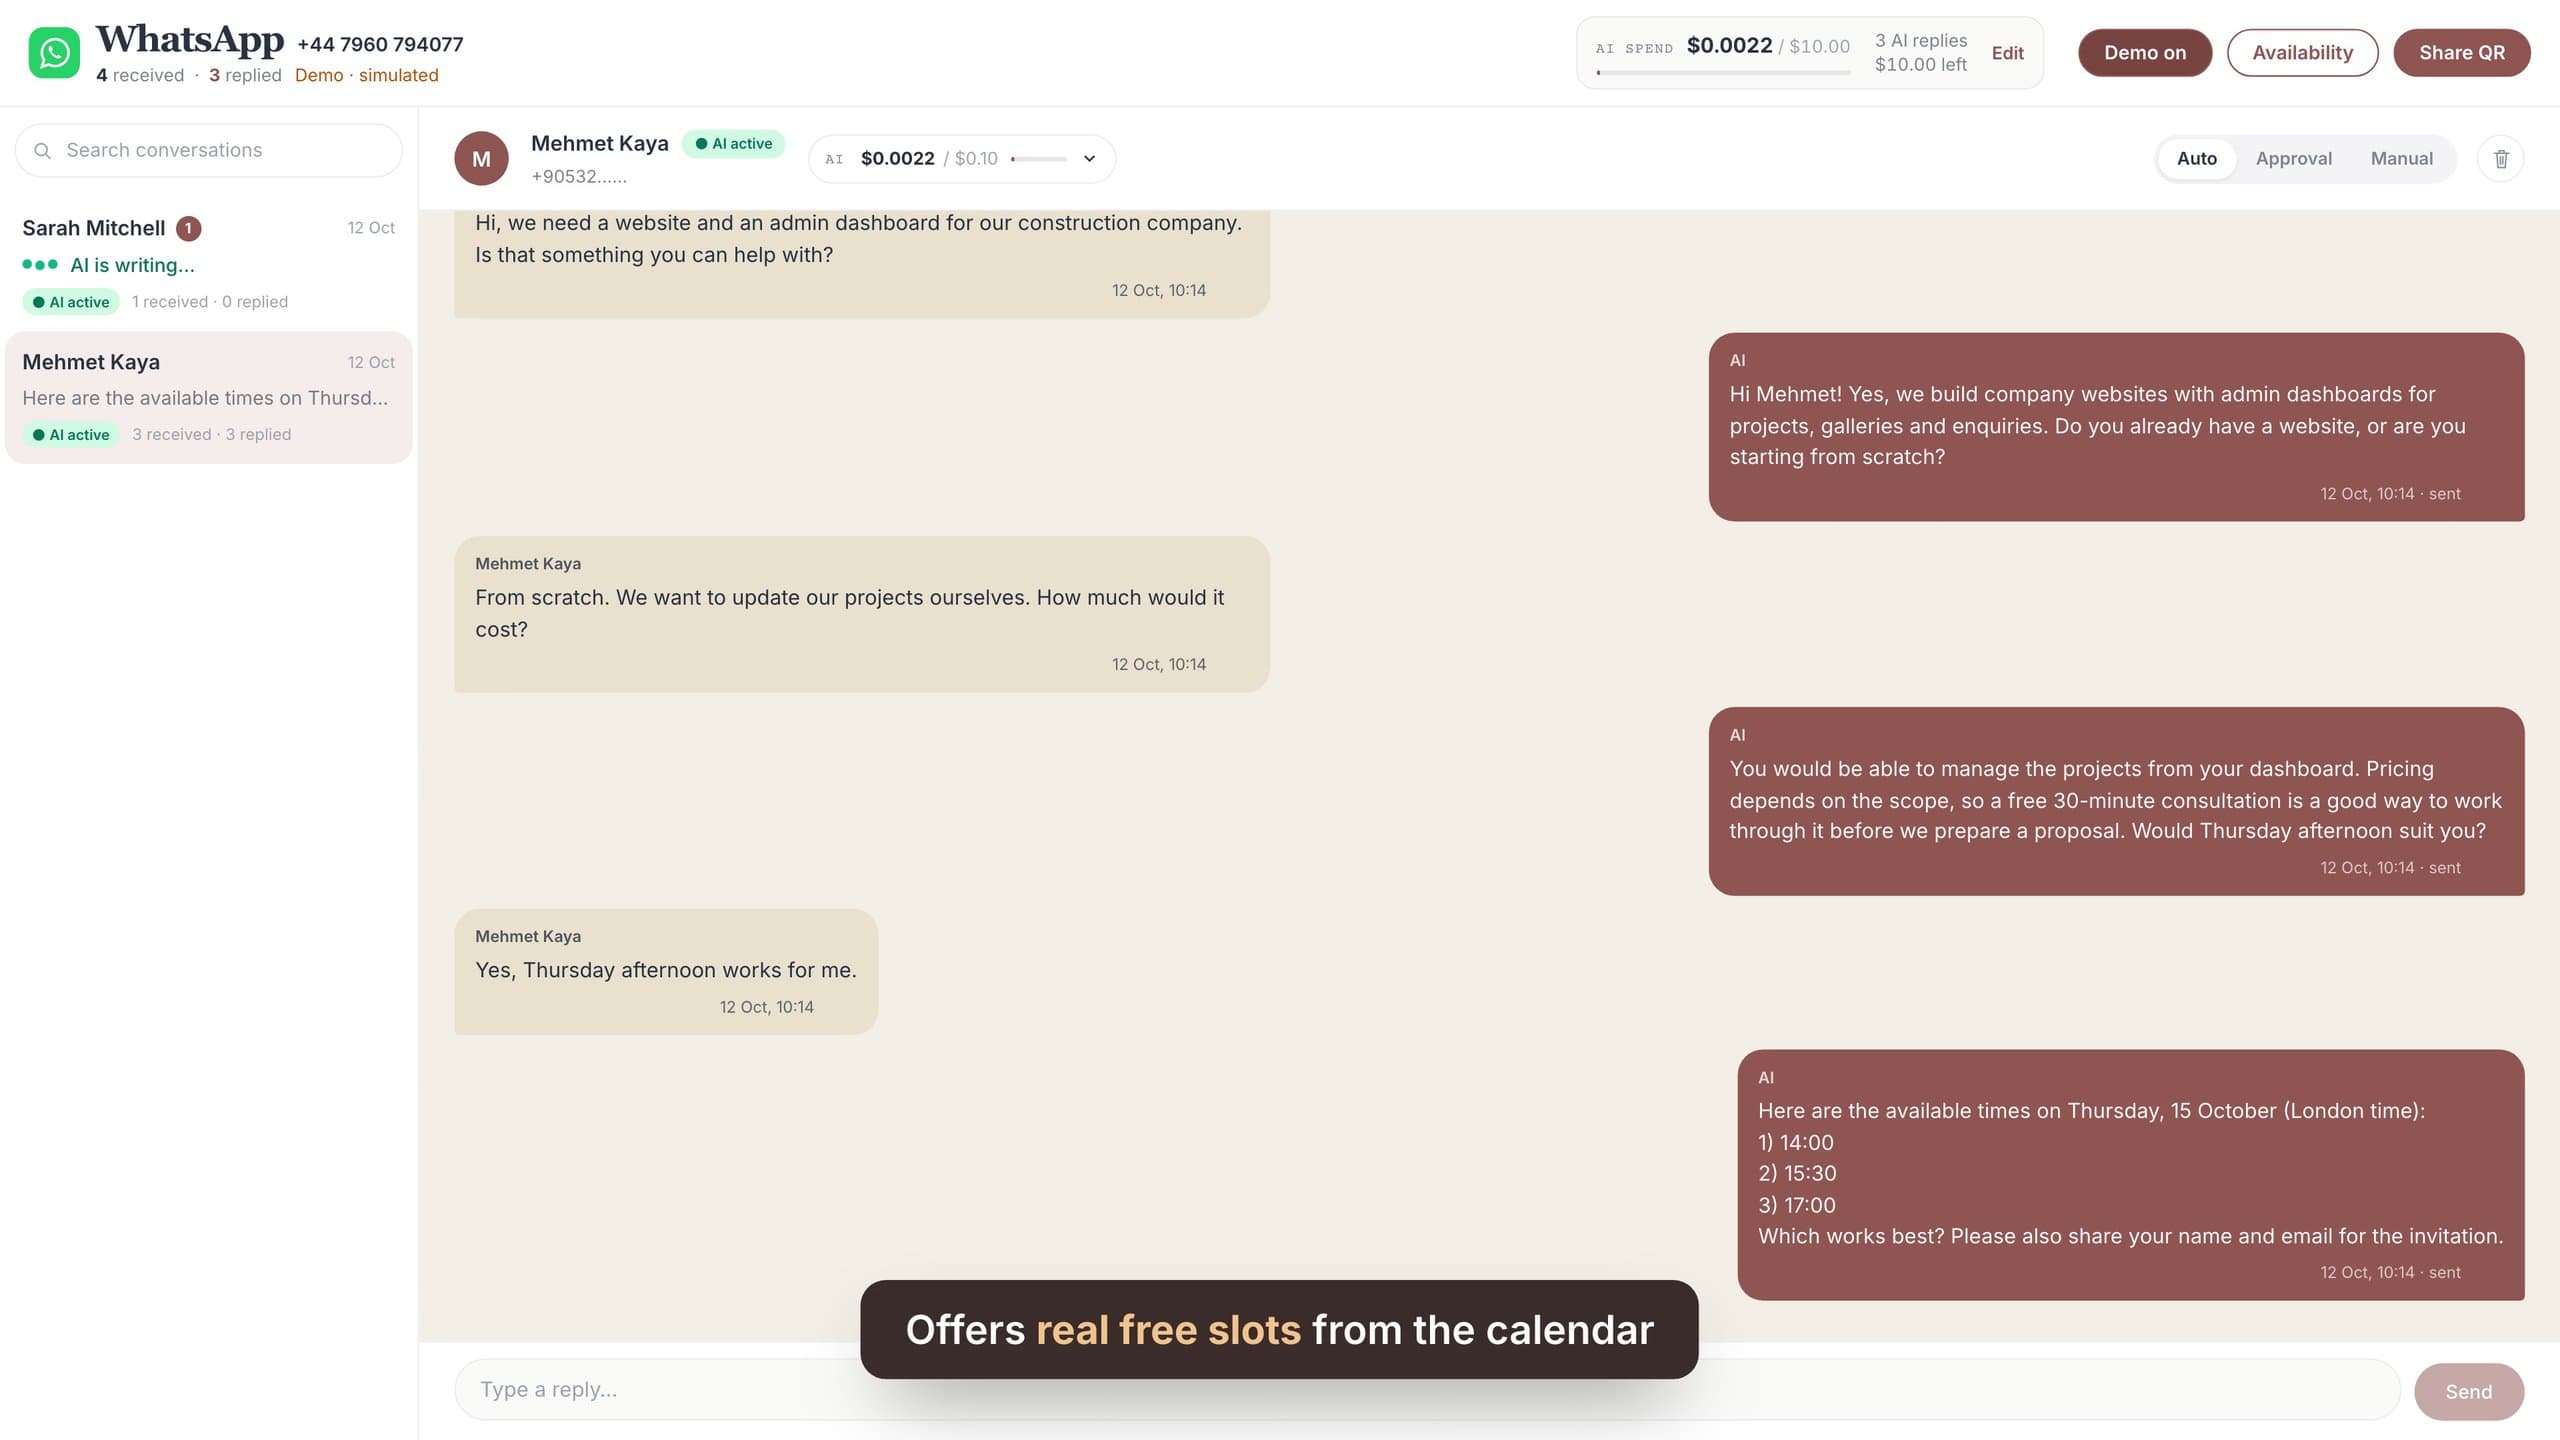
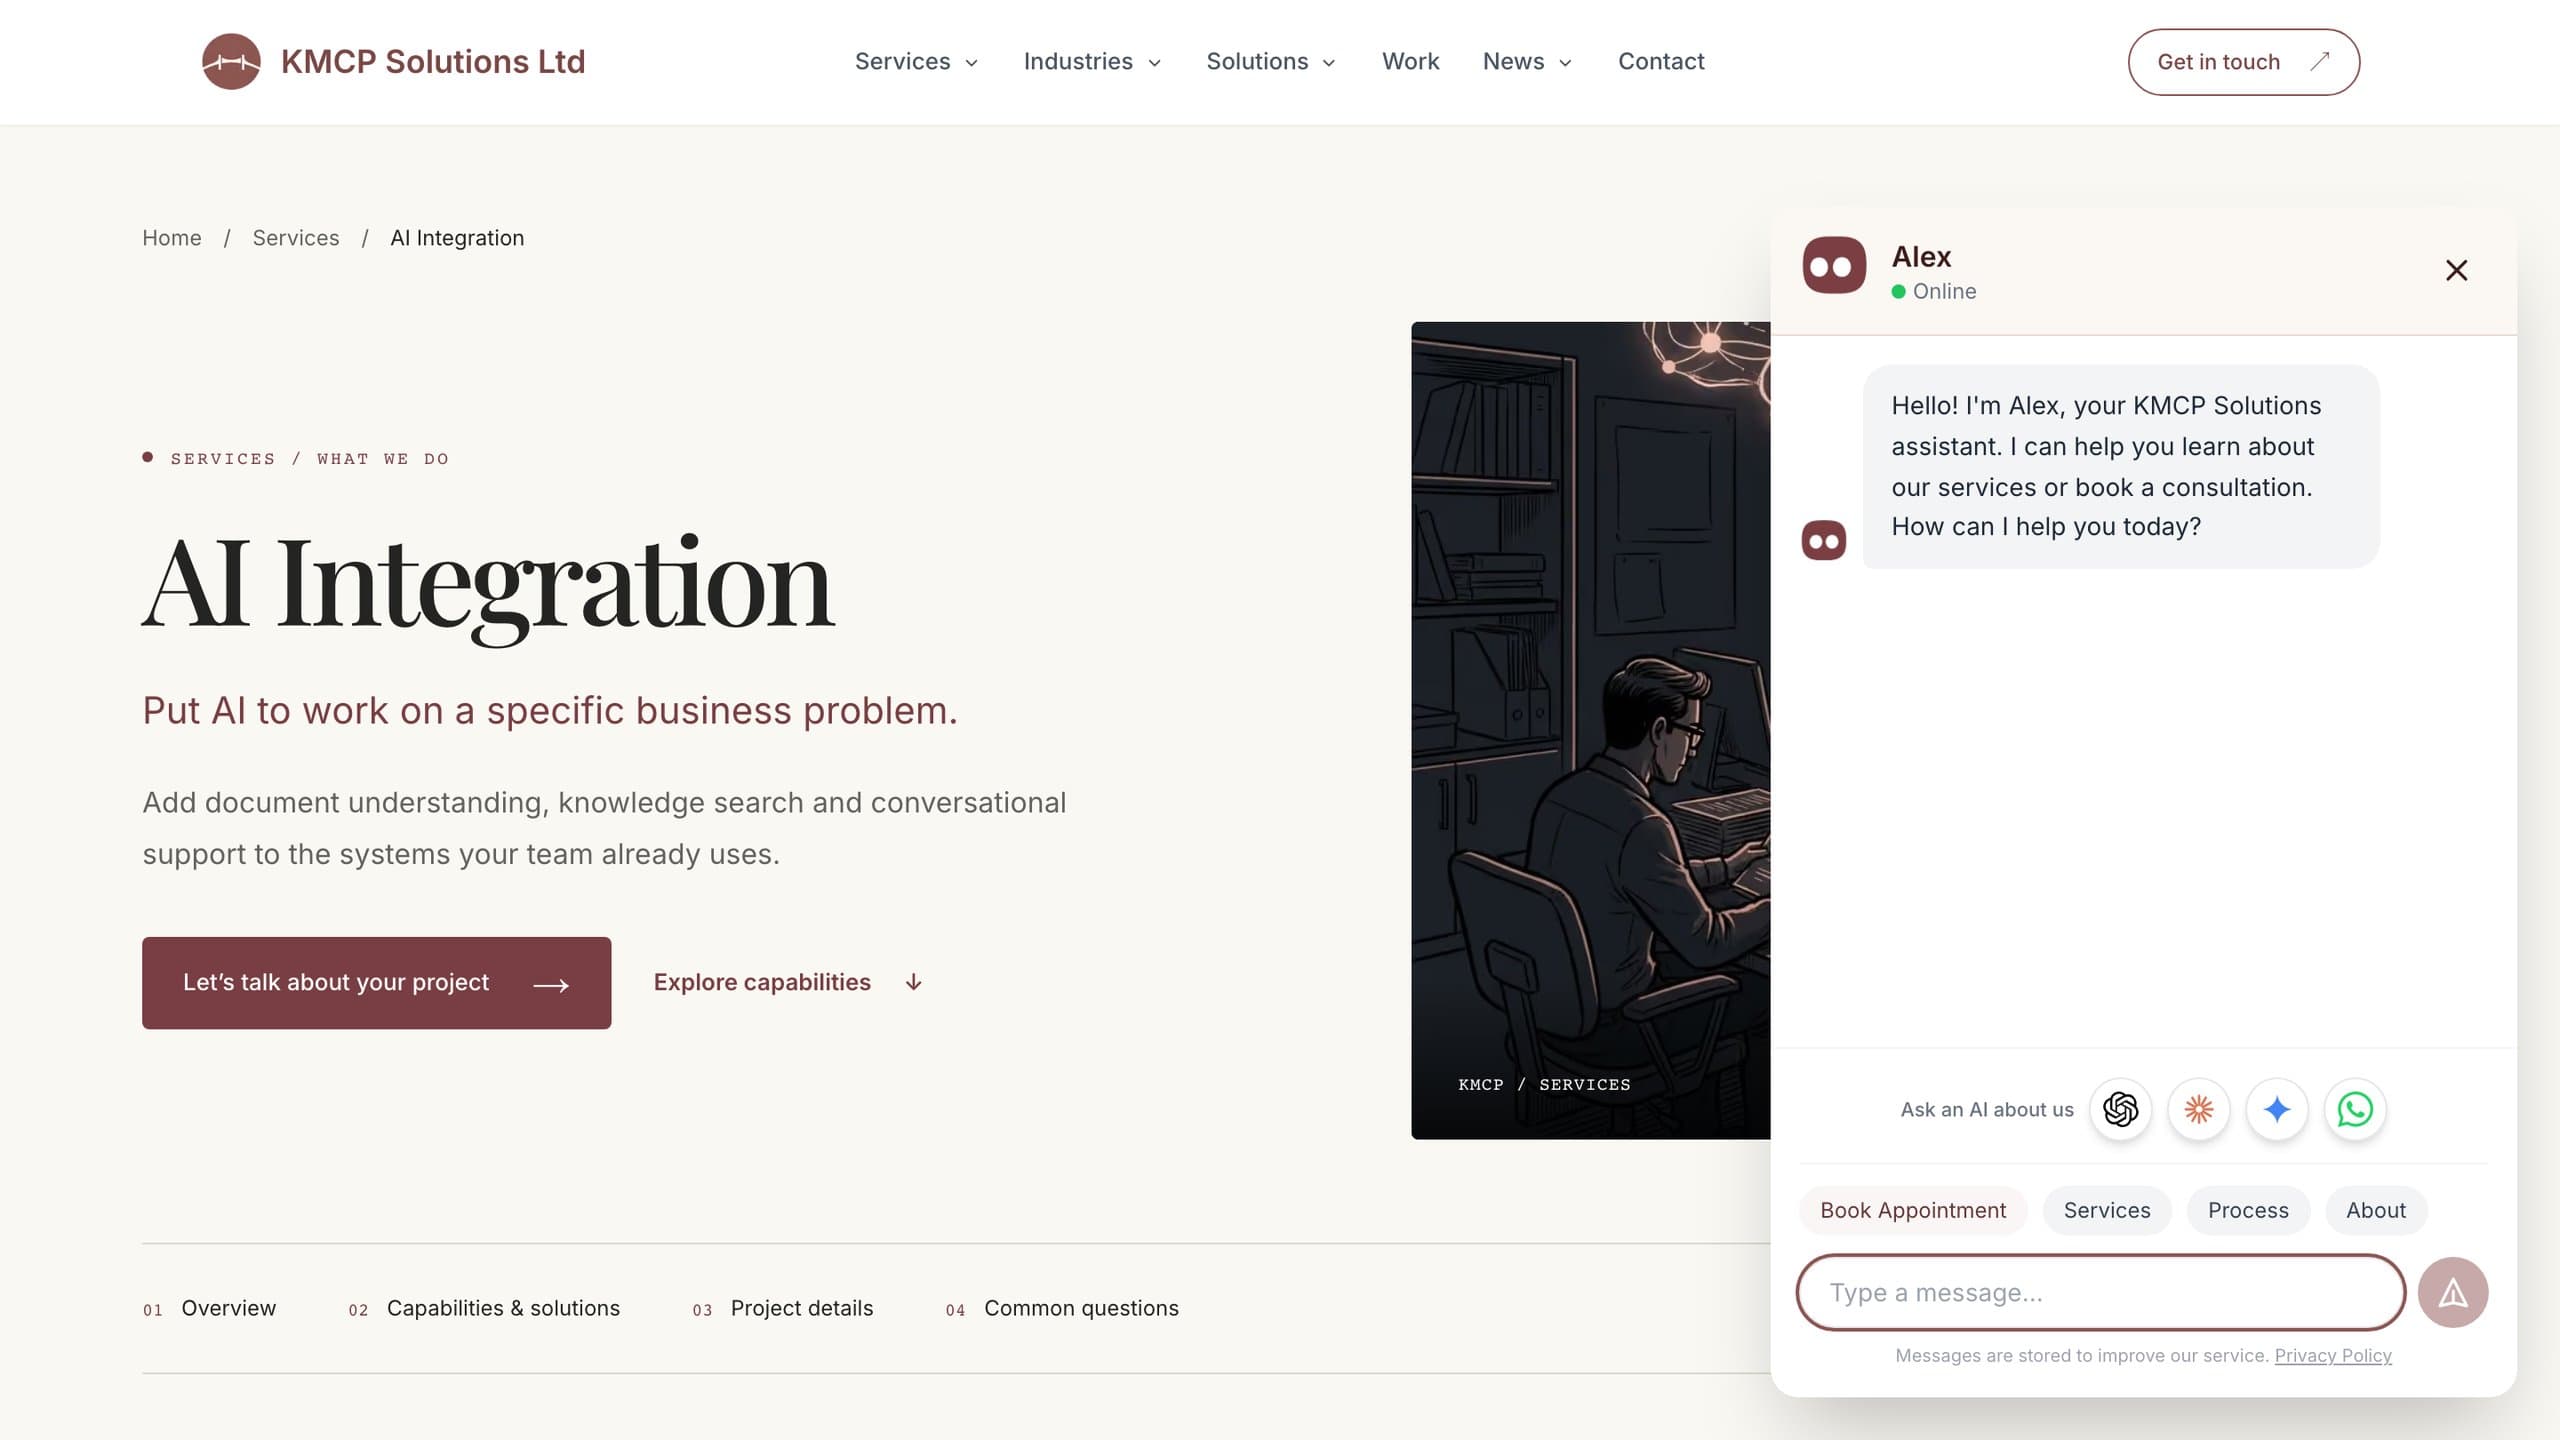
A shared inbox with AI-assisted replies, appointment booking and CRM context for every conversation.